GameStop 2013 Annual Report Download - page 83
Download and view the complete annual report
Please find page 83 of the 2013 GameStop annual report below. You can navigate through the pages in the report by either clicking on the pages listed below, or by using the keyword search tool below to find specific information within the annual report.-
 1
1 -
2
-
3
-
4
-
5
-
6
-
7
-
8
-
9
-
10
-
11
-
12
-
13
-
14
-
15
-
16
-
17
-
18
-
19
-
20
-
21
-
22
-
23
-
24
-
25
-
26
-
27
-
28
-
29
-
30
-
31
-
32
-
33
-
34
-
35
-
36
-
37
-
38
-
39
-
40
-
41
-
42
-
43
-
44
-
45
-
46
-
47
-
48
-
49
-
50
-
51
-
52
-
53
-
54
-
55
-
56
-
57
-
58
-
59
-
60
-
61
-
62
-
63
-
64
-
65
-
66
-
67
-
68
-
69
-
70
-
71
-
72
-
 73
73 -
 74
74 -
 75
75 -
 76
76 -
 77
77 -
 78
78 -
 79
79 -
 80
80 -
 81
81 -
 82
82 -
 83
83 -
 84
84 -
 85
85 -
 86
86 -
 87
87 -
 88
88 -
 89
89 -
 90
90 -
 91
91 -
 92
92 -
 93
93 -
94
-
95
-
96
-
97
-
98
-
99
-
100
-
101
-
102
-
103
-
104
-
105
-
106
-
107
-
108
-
109
-
110
-
111
-
112
-
113
 |
 |

F-10
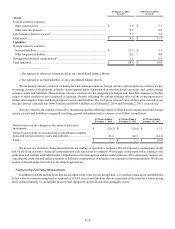
As Previously
Reported Revision As Revised
(In millions)
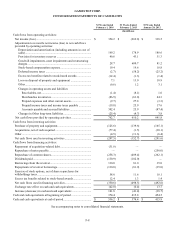
Consolidated Statements of Cash Flows:
For the 53 weeks ended February 2, 2013
Changes in operating assets and liabilities:
Accounts payable and accrued liabilities........................................ $ 48.1 $ (22.2) $ 25.9
Net cash flows provided by operating activities............................. 632.4 (22.2) 610.2
Cash and cash equivalents at beginning of period.......................... 655.0 (239.2) 415.8
Cash and cash equivalents at end of period .................................... 635.8 (261.4) 374.4
For the 52 weeks ended January 28, 2012
Changes in operating assets and liabilities:
Accounts payable and accrued liabilities........................................ (104.5) 17.1 (87.4)
Net cash flows provided by operating activities............................. 624.7 17.1 641.8
Cash and cash equivalents at beginning of period.......................... 710.8 (256.3) 454.5
Cash and cash equivalents at end of period .................................... 655.0 (239.2) 415.8
Use of Estimates
The preparation of financial statements in conformity with accounting principles generally accepted in the United States of
America (“GAAP”) requires us to make estimates and assumptions that affect the reported amounts of assets and liabilities, the
disclosure of contingent assets and liabilities at the date of the financial statements and the reported amounts of revenues and
expenses during the reporting period. In preparing these financial statements, we have made our best estimates and judgments of
certain amounts included in the financial statements, giving due consideration to materiality. Changes in the estimates and
assumptions used by us could have a significant impact on our financial results. Actual results could differ from those estimates.
Cash and Cash Equivalents
We consider all short-term, highly-liquid instruments purchased with an original maturity of three months or less to be cash
equivalents. Our cash and cash equivalents are carried at cost, which approximates market value, and consist primarily of time
deposits with highly rated commercial banks. From time to time depending upon interest rates, credit worthiness and other factors,
we invest in money market investment funds holding direct U.S. Treasury obligations.
Restricted Cash
We consider bank deposits serving as collateral for bank guarantees issued on behalf of our foreign subsidiaries as restricted
cash, which is included in other noncurrent assets in our consolidated balance sheets. Our restricted cash was $16.4 million and
$13.4 million as of February 1, 2014 and February 2, 2013, respectively.
Merchandise Inventories
Our merchandise inventories are carried at the lower of cost or market generally using the average cost method. Under the
average cost method, as new product is received from vendors, its current cost is added to the existing cost of product on-hand
and this amount is re-averaged over the cumulative units. Pre-owned video game products traded in by customers are recorded as
inventory at the amount of the store credit given to the customer. In valuing inventory, we are required to make assumptions
regarding the necessity of reserves required to value potentially obsolete or over-valued items at the lower of cost or market. We
consider quantities on hand, recent sales, potential price protections and returns to vendors, among other factors, when making
these assumptions.
Our ability to assess these factors is dependent upon our ability to forecast customer demand and to provide a well-balanced
merchandise assortment. Inventory is adjusted based on anticipated physical inventory losses or shrinkage and actual losses
resulting from periodic physical inventory counts. Inventory reserves as of February 1, 2014 and February 2, 2013 were $76.5
million and $83.8 million, respectively.