GameStop 2013 Annual Report Download - page 58
Download and view the complete annual report
Please find page 58 of the 2013 GameStop annual report below. You can navigate through the pages in the report by either clicking on the pages listed below, or by using the keyword search tool below to find specific information within the annual report.-
 1
1 -
2
-
3
-
4
-
5
-
6
-
7
-
8
-
9
-
10
-
11
-
12
-
13
-
14
-
15
-
16
-
17
-
18
-
19
-
20
-
21
-
22
-
23
-
24
-
25
-
26
-
27
-
28
-
29
-
30
-
31
-
32
-
33
-
34
-
35
-
36
-
37
-
38
-
39
-
40
-
41
-
42
-
43
-
44
-
45
-
46
-
47
-
 48
48 -
 49
49 -
 50
50 -
 51
51 -
 52
52 -
 53
53 -
 54
54 -
 55
55 -
 56
56 -
 57
57 -
 58
58 -
 59
59 -
 60
60 -
 61
61 -
 62
62 -
 63
63 -
 64
64 -
 65
65 -
 66
66 -
 67
67 -
 68
68 -
69
-
70
-
71
-
72
-
73
-
74
-
75
-
76
-
77
-
78
-
79
-
80
-
81
-
82
-
83
-
84
-
85
-
86
-
87
-
88
-
89
-
90
-
91
-
92
-
93
-
94
-
95
-
96
-
97
-
98
-
99
-
100
-
101
-
102
-
103
-
104
-
105
-
106
-
107
-
108
-
109
-
110
-
111
-
112
-
113
 |
 |
41
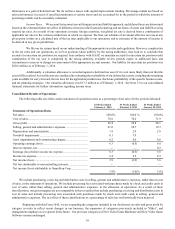
of fixed costs as a result of the decrease in comparable store sales. Included in selling, general and administrative expenses are
$19.6 million and $18.8 million in stock-based compensation expense for fiscal 2012 and fiscal 2011, respectively.
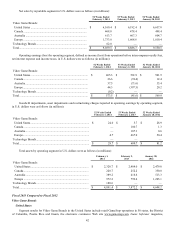
Depreciation and amortization expense decreased $9.8 million from $186.3 million in fiscal 2011 to $176.5 million in fiscal
2012. This decrease was primarily due to the capital expenditures in recent years when compared to prior years, which included
significant investments in our loyalty and digital initiatives, as well as a decrease in new store openings and investments in
management information systems.
During fiscal 2012, we recorded a $680.7 million impairment charge, comprised of $627.0 million of goodwill impairments,
$44.9 million of trade name impairment and $8.8 million of property and equipment impairments. During fiscal 2011, we recorded
asset impairments and restructuring charges of $81.2 million. These charges were primarily due to impairment of our Micromania
trade name in France and impairment and disposal costs related to the exit of non-core businesses, including a small retail movie
chain of stores we owned until fiscal 2011. Restructuring costs include disposal and exit costs related to the exit of underperforming
regions in Europe and consolidation of home office and back office functions, as well as impairment and store closure costs
primarily in the international segments. See Note 9 to our consolidated financial statements for further information associated with
these impairments.
Interest income resulting from the investment of excess cash balances was $0.9 million in both fiscal 2011 and fiscal 2012.
Interest expense decreased from $20.7 million in fiscal 2011 to $4.2 million in fiscal 2012, primarily due to the redemption of the
remaining $250.0 million of our senior notes during fiscal 2011. Debt extinguishment expense of $1.0 million was recognized in
fiscal 2011 as a result of the write-off of deferred financing fees and unamortized original issue discount associated with the
redemption.
Income tax expense was $210.6 million, or 38.4% of earnings before income tax expense, in fiscal 2011 compared to $224.9
million in fiscal 2012. The difference in the effective income tax rate between fiscal 2012 and fiscal 2011 was primarily due to
the recognition of the goodwill impairment charge in fiscal 2012 which was not tax deductible and the recording of valuation
allowances against certain deferred tax assets in the European segment in fiscal 2012. Without the effect of the goodwill impairments
and the recording of the valuation allowances, the effective income tax rate in fiscal 2012 would have been 36.6%. See Note 13
to our consolidated financial statements for additional information regarding income taxes.
The factors described above led to a decrease in operating earnings of $611.5 million from $569.9 million of operating
earnings in fiscal 2011 to $41.6 million of operating loss in fiscal 2012 and a decrease in consolidated net income of $608.3 million
from $338.5 million of consolidated net income in fiscal 2011 to $269.8 million of consolidated net loss in fiscal 2012. The
decrease in operating earnings and consolidated net income is primarily attributable to goodwill impairments recognized in fiscal
2012 offset partially by the decrease in asset impairments and restructuring charges when compared to the prior year. Excluding
the impact of the goodwill and other impairment charges of $680.7 million, operating earnings would have been $639.1 million
and consolidated net income would have been $403.0 million for fiscal 2012. Excluding the impact of asset impairments and
restructuring charges of $81.2 million, operating earnings would have been $651.1 million and consolidated net income would
have been $405.1 million for fiscal 2011.
The $0.1 million net loss attributable to noncontrolling interests for fiscal 2012 represents the portion of the minority interest
stockholders’ net loss of our non-wholly owned subsidiaries included in our consolidated net income. The remaining noncontrolling
interests were purchased during the second quarter of fiscal 2012.
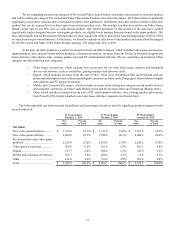
Segment Performance
We operate our business in the following operating segments, which are also our reportable segments: Video Game Brands,
which consists of four segments in the United States, Canada, Australia and Europe, and Technology Brands. We identified these
segments based on a combination of geographic areas, the methods with which we analyze performance, the way in which our
sales and profits are derived and how we divide management responsibility. Our sales and profits are driven through our physical
stores which are highly integrated with our e-commerce, digital and mobile businesses. Due to this integration, our physical stores
are the basis for our segment reporting. Each of the Video Game Brands segments consists primarily of retail operations, with all
stores engaged in the sale of new and pre-owned video game systems, software and accessories (which we refer to as video game
products), new and pre-owned mobile devices and related accessories. These products are substantially the same regardless of
geographic location, with the primary differences in merchandise carried being the timing of the release of new products or
technologies in the various segments. Stores in all Video Game Brands segments are similar in size at an average of approximately
1,400 square feet. The Technology Brands segment offers wireless services, devices and related accessories and sells Apple
products.
With our presence in international markets, we have operations in several foreign currencies, including the Euro, Australian
dollar, New Zealand dollar, Canadian dollar, British pound, Swiss franc, Danish kroner, Swedish krona, and the Norwegian kroner.