GameStop 2013 Annual Report Download - page 63
Download and view the complete annual report
Please find page 63 of the 2013 GameStop annual report below. You can navigate through the pages in the report by either clicking on the pages listed below, or by using the keyword search tool below to find specific information within the annual report.-
 1
1 -
2
-
3
-
4
-
5
-
6
-
7
-
8
-
9
-
10
-
11
-
12
-
13
-
14
-
15
-
16
-
17
-
18
-
19
-
20
-
21
-
22
-
23
-
24
-
25
-
26
-
27
-
28
-
29
-
30
-
31
-
32
-
33
-
34
-
35
-
36
-
37
-
38
-
39
-
40
-
41
-
42
-
43
-
44
-
45
-
46
-
47
-
48
-
49
-
50
-
51
-
52
-
 53
53 -
 54
54 -
 55
55 -
 56
56 -
 57
57 -
 58
58 -
 59
59 -
 60
60 -
 61
61 -
 62
62 -
 63
63 -
 64
64 -
 65
65 -
 66
66 -
 67
67 -
 68
68 -
 69
69 -
 70
70 -
 71
71 -
 72
72 -
 73
73 -
74
-
75
-
76
-
77
-
78
-
79
-
80
-
81
-
82
-
83
-
84
-
85
-
86
-
87
-
88
-
89
-
90
-
91
-
92
-
93
-
94
-
95
-
96
-
97
-
98
-
99
-
100
-
101
-
102
-
103
-
104
-
105
-
106
-
107
-
108
-
109
-
110
-
111
-
112
-
113
 |
 |

46
Liquidity and Capital Resources
Overview
Based on our current operating plans, we believe that available cash balances, cash generated from our operating activities
and funds available under our $400 million asset-based revolving credit facility (the "Revolver") together will provide sufficient
liquidity to fund our operations, store openings and remodeling activities and corporate capital expenditure programs, including
the payment of dividends declared by the Board of Directors, for at least the next 12 months. On an ongoing basis, we will evaluate
and consider strategic acquisitions, divestitures, repurchasing shares of our common stock or other transactions to create shareholder
value and enhance financial performance. Such transactions may generate proceeds or require cash expenditures.
As of February 1, 2014, $398.9 million of our total cash on hand of $536.2 million was attributable to our foreign operations.
Although we may, from time to time, evaluate strategies and alternatives with respect to the cash attributable to our foreign
operations, we currently anticipate that this cash will remain in those foreign jurisdictions and it therefore may not be available
for immediate use; however, we believe that our existing sources of liquidity, as described more fully above, will enable us to
meet our cash requirements in the next twelve months.
We had total cash on hand of $536.2 million and an additional $391.0 million of available future borrowing capacity under
the Revolver. Based on our current expectations, we believe our liquidity and capital resources will be sufficient to operate our
business. However, we may, from time to time, raise additional funds through borrowings or public or private sales of debt or
equity securities. The amount, nature and timing of any borrowings or sales of debt or equity securities will depend on our operating
performance and other circumstances; our then-current commitments and obligations; the amount, nature and timing of our capital
requirements; any limitations imposed by our current credit arrangements; and overall market conditions.
We have revised the presentation of outstanding checks in our prior period financial statements. Previously, we reduced cash
and liabilities when the checks were presented for payment and cleared our bank accounts. As of February 1, 2014, we reduce
cash and liabilities when the checks are released for payment.
The impact of this revision on our consolidated statements of cash flows for the 53 weeks ended February 2, 2013 and the
52 weeks ended January 28, 2012 are as follows:
As Previously
Reported Revision As Revised
(In millions)
Consolidated Statements of Cash Flows:
For the 53 weeks ended February 2, 2013
Changes in operating assets and liabilities:
Accounts payable and accrued liabilities ........................................ $ 48.1 $ (22.2) $ 25.9
Net cash flows provided by operating activities ............................. 632.4 (22.2) 610.2
Cash and cash equivalents at beginning of period .......................... 655.0 (239.2) 415.8
Cash and cash equivalents at end of period .................................... 635.8 (261.4) 374.4
For the 52 weeks ended January 28, 2012
Changes in operating assets and liabilities:
Accounts payable and accrued liabilities ........................................ (104.5) 17.1 (87.4)
Net cash flows provided by operating activities ............................. 624.7 17.1 641.8
Cash and cash equivalents at beginning of period .......................... 710.8 (256.3) 454.5
Cash and cash equivalents at end of period .................................... 655.0 (239.2) 415.8
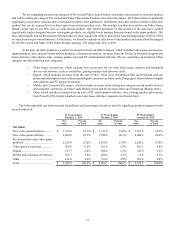
Cash Flows
During fiscal 2013, cash provided by operations was $762.7 million, compared to cash provided by operations of
$610.2 million in fiscal 2012. The increase in cash provided by operations of $152.5 million from fiscal 2012 to fiscal 2013 was
primarily due to an increase in cash provided by working capital of $176.9 million, primarily driven by a change in the timing of
payments of accounts payable, partially offset by higher inventory purchases in fiscal 2013. The higher inventory purchases in
fiscal 2013 were primarily due to purchases to support the launch of new consoles.