GameStop 2013 Annual Report Download - page 101
Download and view the complete annual report
Please find page 101 of the 2013 GameStop annual report below. You can navigate through the pages in the report by either clicking on the pages listed below, or by using the keyword search tool below to find specific information within the annual report.-
 1
1 -
2
-
3
-
4
-
5
-
6
-
7
-
8
-
9
-
10
-
11
-
12
-
13
-
14
-
15
-
16
-
17
-
18
-
19
-
20
-
21
-
22
-
23
-
24
-
25
-
26
-
27
-
28
-
29
-
30
-
31
-
32
-
33
-
34
-
35
-
36
-
37
-
38
-
39
-
40
-
41
-
42
-
43
-
44
-
45
-
46
-
47
-
48
-
49
-
50
-
51
-
52
-
53
-
54
-
55
-
56
-
57
-
58
-
59
-
60
-
61
-
62
-
63
-
64
-
65
-
66
-
67
-
68
-
69
-
70
-
71
-
72
-
73
-
74
-
75
-
76
-
77
-
78
-
79
-
80
-
81
-
82
-
83
-
84
-
85
-
86
-
87
-
88
-
89
-
90
-
 91
91 -
 92
92 -
 93
93 -
 94
94 -
 95
95 -
 96
96 -
 97
97 -
 98
98 -
 99
99 -
 100
100 -
 101
101 -
 102
102 -
 103
103 -
 104
104 -
 105
105 -
 106
106 -
 107
107 -
 108
108 -
 109
109 -
 110
110 -
 111
111 -
112
-
113
 |
 |

F-28
52 Weeks Ended
February 1, 2014
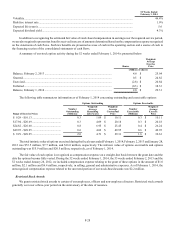
Volatility................................................................................................................................................... 46.4%
Risk-free interest rate ............................................................................................................................... 1.0%
Expected life (years)................................................................................................................................. 5.6
Expected dividend yield ........................................................................................................................... 4.3%
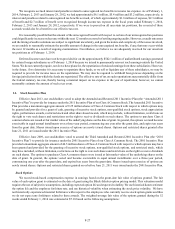
In addition to recognizing the estimated fair value of stock-based compensation in earnings over the required service period,
we are also required to present tax benefits received in excess of amounts determined based on the compensation expense recognized
on the statements of cash flows. Such tax benefits are presented as a use of cash in the operating section and a source of cash in
the financing section of the consolidated statements of cash flows.
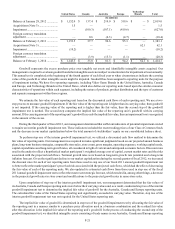
A summary of our stock option activity during the 52 weeks ended February 1, 2014 is presented below:
Shares
Weighted-
Average
Exercise
Price
(Millions of shares)
Balance, February 2, 2013 ........................................................................................... 4.6 $ 25.04
Granted......................................................................................................................... 0.5 $ 24.82
Exercised...................................................................................................................... (2.8) $ 20.84
Forfeited....................................................................................................................... (0.3) $ 38.33
Balance, February 1, 2014 ........................................................................................... 2.0 $ 29.31
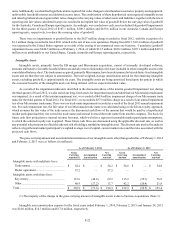
The following table summarizes information as of February 1, 2014 concerning outstanding and exercisable options:
Options Outstanding Options Exercisable
Range of Exercise Prices
Number
Outstanding
(Millions)
Weighted-
Average
Remaining
Life (Years)
Weighted-
Average
Contractual
Price
Number
Exercisable
(Millions)
Weighted-
Average
Exercise
Price
$ 9.29 - $10.13 ....................................... 0.3 1.09 $ 10.11 0.3 $ 10.11
$17.94 - $20.69 ....................................... 0.3 4.09 $ 20.18 0.3 $ 20.18
$24.82 - $26.68 ....................................... 0.8 6.95 $ 25.45 0.4 $ 26.24
$49.95 - $49.95 ....................................... 0.6 4.02 $ 49.95 0.6 $ 49.95
$ 9.29 - $49.95 ....................................... 2.0 4.71 $ 29.31 1.6 $ 30.61
The total intrinsic value of options exercised during the fiscal years ended February 1, 2014, February 2, 2013 and January 28,
2012 was $53.5 million, $7.7 million, and $16.0 million, respectively. The intrinsic value of options exercisable and options
outstanding was $15.9 million and $20.5 million, respectively, as of February 1, 2014.
The fair value of each option is recognized as compensation expense on a straight-line basis between the grant date and the
date the options become fully vested. During the 52 weeks ended February 1, 2014, the 53 weeks ended February 2, 2013 and the
52 weeks ended January 28, 2012, we included compensation expense relating to the grant of these options in the amount of $1.0
million, $2.1 million and $6.4 million, respectively, in selling, general and administrative expenses. As of February 1, 2014, the
unrecognized compensation expense related to the unvested portion of our stock-based awards was $2.2 million.
Restricted Stock Awards
We grant restricted stock awards to certain of our employees, officers and non-employee directors. Restricted stock awards
generally vest over a three-year period on the anniversary of the date of issuance.