GameStop 2013 Annual Report Download - page 45
Download and view the complete annual report
Please find page 45 of the 2013 GameStop annual report below. You can navigate through the pages in the report by either clicking on the pages listed below, or by using the keyword search tool below to find specific information within the annual report.-
 1
1 -
2
-
3
-
4
-
5
-
6
-
7
-
8
-
9
-
10
-
11
-
12
-
13
-
14
-
15
-
16
-
17
-
18
-
19
-
20
-
21
-
22
-
23
-
24
-
25
-
26
-
27
-
28
-
29
-
30
-
31
-
32
-
33
-
34
-
 35
35 -
 36
36 -
 37
37 -
 38
38 -
 39
39 -
 40
40 -
 41
41 -
 42
42 -
 43
43 -
 44
44 -
 45
45 -
 46
46 -
 47
47 -
 48
48 -
 49
49 -
 50
50 -
 51
51 -
 52
52 -
 53
53 -
 54
54 -
 55
55 -
56
-
57
-
58
-
59
-
60
-
61
-
62
-
63
-
64
-
65
-
66
-
67
-
68
-
69
-
70
-
71
-
72
-
73
-
74
-
75
-
76
-
77
-
78
-
79
-
80
-
81
-
82
-
83
-
84
-
85
-
86
-
87
-
88
-
89
-
90
-
91
-
92
-
93
-
94
-
95
-
96
-
97
-
98
-
99
-
100
-
101
-
102
-
103
-
104
-
105
-
106
-
107
-
108
-
109
-
110
-
111
-
112
-
113
 |
 |

28
Issuer Purchases of Equity Securities
Our purchases of our equity securities during the fourth quarter of the fiscal year ended February 1, 2014 were as follows:
Period
Total
Number of
Shares
Purchased
Average
Price Paid per
Share
Total Number of
Shares Purchased
as Part of Publicly
Announced Plans or
Programs
Approximate Dollar
Value of Shares that
May Yet Be Purchased
Under the Plans or
Programs(1)
(In millions of dollars)
November 3, 2013 through
November 30, 2013 ........................ 321,500 $ 51.62 321,500 $ 490.0
December 1, 2013 through
January 4, 2014 .............................. 479,000 $ 47.90 479,000 $ 467.1
January 5, 2014 through
February 1, 2014 ............................ 237,300 $ 42.05 237,300 $ 457.1
Total ................................................... 1,037,800 $ 47.71 1,037,800
(1) In November 2012, the Board of Directors authorized $500 million to be used for share repurchases. In November 2013,
the Board of Directors authorized $500 million to be used for share repurchases, replacing the November 2012 authorization.
The November 2013 $500 million authorization has no expiration date.
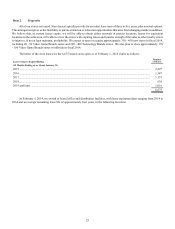
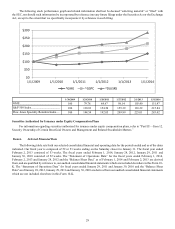
GameStop Stock Comparative Performance Graph
The following graph compares the cumulative total stockholder return on our Class A Common Stock for the period
commencing January 30, 2009 through January 31, 2014 (the last trading date of fiscal 2013) with the cumulative total return on
the Standard & Poor’s 500 Stock Index (the “S&P 500”) and the Dow Jones Retailers, Other Specialty Industry Group Index (the
“Dow Jones Specialty Retailers Index”) over the same period. Total return values were calculated based on cumulative total return
assuming (i) the investment of $100 in our Class A Common Stock, the S&P 500 and the Dow Jones Specialty Retailers Index on
January 30, 2009 and (ii) reinvestment of dividends.