GameStop 2013 Annual Report Download - page 94
Download and view the complete annual report
Please find page 94 of the 2013 GameStop annual report below. You can navigate through the pages in the report by either clicking on the pages listed below, or by using the keyword search tool below to find specific information within the annual report.-
 1
1 -
2
-
3
-
4
-
5
-
6
-
7
-
8
-
9
-
10
-
11
-
12
-
13
-
14
-
15
-
16
-
17
-
18
-
19
-
20
-
21
-
22
-
23
-
24
-
25
-
26
-
27
-
28
-
29
-
30
-
31
-
32
-
33
-
34
-
35
-
36
-
37
-
38
-
39
-
40
-
41
-
42
-
43
-
44
-
45
-
46
-
47
-
48
-
49
-
50
-
51
-
52
-
53
-
54
-
55
-
56
-
57
-
58
-
59
-
60
-
61
-
62
-
63
-
64
-
65
-
66
-
67
-
68
-
69
-
70
-
71
-
72
-
73
-
74
-
75
-
76
-
77
-
78
-
79
-
80
-
81
-
82
-
83
-
 84
84 -
 85
85 -
 86
86 -
 87
87 -
 88
88 -
 89
89 -
 90
90 -
 91
91 -
 92
92 -
 93
93 -
 94
94 -
 95
95 -
 96
96 -
 97
97 -
 98
98 -
 99
99 -
 100
100 -
 101
101 -
 102
102 -
 103
103 -
 104
104 -
105
-
106
-
107
-
108
-
109
-
110
-
111
-
112
-
113
 |
 |

F-21
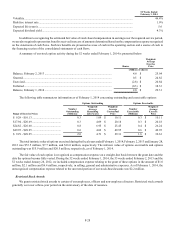
United States Canada Australia Europe
Technology
Brands Total
(In millions)
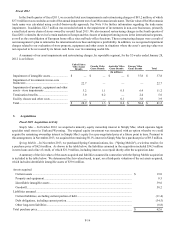
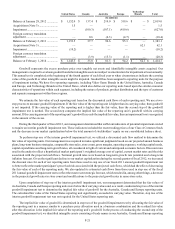
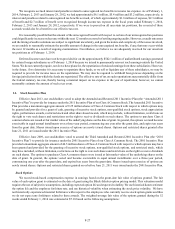
Balance at January 28, 2012 ............... $ 1,152.0 $ 137.4 $ 210.0 $ 519.6 $ — $ 2,019.0
Acquisitions (Note 3) .......................... 1.5 — — — — 1.5
Impairment .......................................... — (100.3)(107.1)(419.6)—
(627.0)
Foreign currency translation
adjustment ........................................... — 0.6 (6.3)(4.7)—
(10.4)
Balance at February 2, 2013 ............... 1,153.5 37.7 96.6 95.3 — 1,383.1
Acquisitions (Note 3) .......................... — — — — 62.1 62.1
Impairment .......................................... (10.2) — — — — (10.2)
Foreign currency translation
adjustment ........................................... —(3.9)(15.3)(1.1)—
(20.3)
Balance at February 1, 2014 ............... $ 1,143.3 $ 33.8 $ 81.3 $ 94.2 $ 62.1 $ 1,414.7
Goodwill represents the excess purchase price over tangible net assets and identifiable intangible assets acquired. Our
management is required to evaluate goodwill and other intangible assets not subject to amortization for impairment at least annually.
This annual test is completed at the beginning of the fourth quarter of each fiscal year or when circumstances indicate the carrying
value of the goodwill or other intangible assets might be impaired. Goodwill has been assigned to reporting units for the purpose
of impairment testing. We have five operating segments, including Video Game Brands in the United States, Australia, Canada
and Europe, and Technology Brands in the United States, which also define our reporting units based upon the similar economic
characteristics of operations within each segment, including the nature of products, product distribution and the type of customer
and separate management within those regions.
We estimate the fair value of each reporting unit based on the discounted cash flows of each reporting unit. We use a two-
step process to measure goodwill impairment. If the fair value of the reporting unit is higher than its carrying value, then goodwill
is not impaired. If the carrying value of the reporting unit is higher than the fair value, then the second step of the goodwill
impairment test is needed. The second step compares the implied fair value of the reporting unit’s goodwill with its carrying
amount. If the carrying amount of the reporting unit’s goodwill exceeds the implied fair value, then an impairment loss is recognized
in the amount of the excess.
During the third quarter of fiscal 2012, our management determined that sufficient indicators of potential impairment existed
to require an interim goodwill impairment test. These indicators included the recent trading prices of our Class A Common Stock
and the decrease in our market capitalization below the total amount of stockholders’ equity on our consolidated balance sheet.
To perform step one of the interim goodwill impairment test, we utilized a discounted cash flow method to determine the
fair value of reporting units. Our management was required to make significant judgments based on our projected annual business
plans, long-term business strategies, comparable store sales, store count, gross margins, operating expenses, working capital needs,
capital expenditures and long-term growth rates, all considered in light of current and anticipated economic factors. Discount rates
used in the analysis reflect a hypothetical market participant’s weighted average cost of capital, current market rates and the risks
associated with the projected cash flows. Terminal growth rates were based on long-term growth rate potential and a long-term
inflation forecast. Given the significant decline in our market capitalization during the second quarter of fiscal 2012, we increased
the discount rates for each of our reporting units from those used in step one of our fiscal 2011 annual goodwill impairment test
to better reflect the market participant’s perceived risk associated with the projected cash flows, which had the effect of decreasing
the fair value of each of the reporting units. We also updated its estimated cash flows from those used in step one of the fiscal
2011 annual goodwill impairment test to reflect the most recent strategic forecast, which resulted in, among other things, a decrease
in the projected growth rates in store count and modifications to the projected growth rates in same-store sales.
Upon completion of step one of the interim goodwill impairment test, our management determined that the fair values of
its Australia, Canada and Europe reporting units were below their carrying values and, as a result, conducted step two of the interim
goodwill impairment test to determine the implied fair value of goodwill for the Australia, Canada and Europe reporting units.
The calculated fair value of the United States reporting unit significantly exceeded its carrying value. Therefore, step two of the
interim goodwill impairment test was not required for the United States reporting unit.
The implied fair value of goodwill is determined in step two of the goodwill impairment test by allocating the fair value of
the reporting unit in a manner similar to a purchase price allocation used in a business combination and the residual fair value
after this allocation is the implied fair value of the reporting unit’s goodwill. In the process of conducting the second step of the
goodwill impairment test, we identified intangible assets consisting of trade names in our Australia, Canada and Europe reporting