GameStop 2013 Annual Report Download - page 4
Download and view the complete annual report
Please find page 4 of the 2013 GameStop annual report below. You can navigate through the pages in the report by either clicking on the pages listed below, or by using the keyword search tool below to find specific information within the annual report.-
 1
1 -
 2
2 -
 3
3 -
 4
4 -
 5
5 -
 6
6 -
 7
7 -
 8
8 -
 9
9 -
 10
10 -
 11
11 -
 12
12 -
 13
13 -
 14
14 -
 15
15 -
16
-
17
-
18
-
19
-
20
-
21
-
22
-
23
-
24
-
25
-
26
-
27
-
28
-
29
-
30
-
31
-
32
-
33
-
34
-
35
-
36
-
37
-
38
-
39
-
40
-
41
-
42
-
43
-
44
-
45
-
46
-
47
-
48
-
49
-
50
-
51
-
52
-
53
-
54
-
55
-
56
-
57
-
58
-
59
-
60
-
61
-
62
-
63
-
64
-
65
-
66
-
67
-
68
-
69
-
70
-
71
-
72
-
73
-
74
-
75
-
76
-
77
-
78
-
79
-
80
-
81
-
82
-
83
-
84
-
85
-
86
-
87
-
88
-
89
-
90
-
91
-
92
-
93
-
94
-
95
-
96
-
97
-
98
-
99
-
100
-
101
-
102
-
103
-
104
-
105
-
106
-
107
-
108
-
109
-
110
-
111
-
112
-
113
 |
 |

2013 ANNUAL REPORT POWER TO THE PLAYERS
TO OUR SHAREHOLDERS
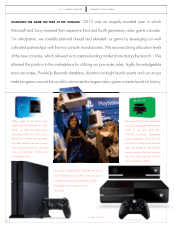
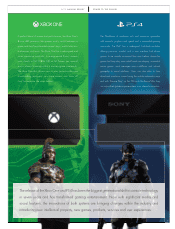
What a year 2013 turned out to be! We entered the year with a laser focus on leveraging our leading market share to secure the dominant
role in bringing innovation back to the gaming industry. As a result, we captured the No. 1 retail position in selling the next generation
video game consoles and new video game titles introduced throughout the year.
Our success was driven by our ability to work closely with our vendor partners to secure strong allocation levels of the new consoles and
video games for day one launch. We also offered customers around the world the opportunity to reserve and pay for their new consoles
with the more than $1 billion of trade credits we provided through our video game and consumer electronics buy-sell-trade model.
We continued driving positive customer experiences in both our physical and virtual storefronts by delivering the highest service,
greatest product knowledge and convenience for customers to purchase video game products. We provided free shipping for all
web-in-store purchases, and our supply chain and logistics teams worked around the clock to make sure customers received their
purchases on time.
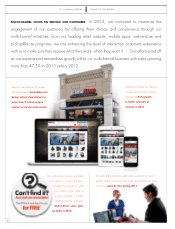
Our multichannel business (mobile, web-in-store, pick-up@store, e-commerce) had a very positive impact on GameStop’s overall business.
More than 60% of customers visit GameStop via either our web or mobile sites prior to making a purchase inside our stores, and for every
$1 of online sales, our web and mobile channels influence 10 times that amount in our stores.
We rewarded our 34 million global PowerUp Rewards™ members with many pre-owned promotional and trade programs, exclusive
midnight launch deals, consumer electronics specials and great prizes to solidify our position as the destination for all things gaming. Our
customer loyalty programs are now active in 10 countries, including Australia, Austria, Canada, France, Germany, Ireland, Italy, Spain,
Switzerland and the United States.
GameStop International performed well in 2013. Our continued investments in technology, customer loyalty and relationship management,
e-commerce, as well as improved vendor collaboration and the international expansion of Game Informer magazine, helped deliver strong
topline growth.
Our associates showed their true GameStop spirit by continuing to give back to the communities where we live, serve and play. We
gave to those in need through our partnerships with Make-A-Wish®, Ronald McDonald House Charities® and St. Jude Children’s
Research Hospital®. We also took care of our GameStop family through associate contributions to our Gamer Fund™ employee
assistance program.
Looking ahead to the next chapter of GameStop’s growth, we have studied the ways in which technology products are distributed to
consumers outside the gaming space and believe synergies exist with our model. We believe it is important to drive a high rate of internal
change to adapt and meet the changing needs of our customers.
2