GameStop 2013 Annual Report Download - page 82
Download and view the complete annual report
Please find page 82 of the 2013 GameStop annual report below. You can navigate through the pages in the report by either clicking on the pages listed below, or by using the keyword search tool below to find specific information within the annual report.-
 1
1 -
2
-
3
-
4
-
5
-
6
-
7
-
8
-
9
-
10
-
11
-
12
-
13
-
14
-
15
-
16
-
17
-
18
-
19
-
20
-
21
-
22
-
23
-
24
-
25
-
26
-
27
-
28
-
29
-
30
-
31
-
32
-
33
-
34
-
35
-
36
-
37
-
38
-
39
-
40
-
41
-
42
-
43
-
44
-
45
-
46
-
47
-
48
-
49
-
50
-
51
-
52
-
53
-
54
-
55
-
56
-
57
-
58
-
59
-
60
-
61
-
62
-
63
-
64
-
65
-
66
-
67
-
68
-
69
-
70
-
71
-
 72
72 -
 73
73 -
 74
74 -
 75
75 -
 76
76 -
 77
77 -
 78
78 -
 79
79 -
 80
80 -
 81
81 -
 82
82 -
 83
83 -
 84
84 -
 85
85 -
 86
86 -
 87
87 -
 88
88 -
 89
89 -
 90
90 -
 91
91 -
 92
92 -
93
-
94
-
95
-
96
-
97
-
98
-
99
-
100
-
101
-
102
-
103
-
104
-
105
-
106
-
107
-
108
-
109
-
110
-
111
-
112
-
113
 |
 |

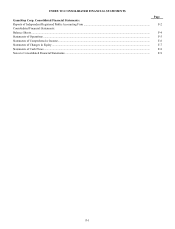
F-9
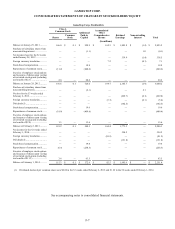
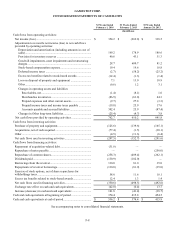
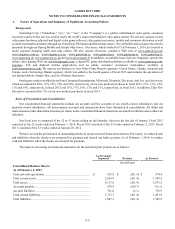
GAMESTOP CORP.
NOTES TO CONSOLIDATED FINANCIAL STATEMENTS
1. Nature of Operations and Summary of Significant Accounting Policies
Background
GameStop Corp. (“GameStop,” “we,” “us,” “our,” or the “Company”) is a global, multichannel video game, consumer
electronics and wireless services retailer and is the world’s largest multichannel video game retailer. We sell new and pre-owned
video game hardware, physical and digital video game software, video game accessories, mobile and consumer electronics as well
as other merchandise primarily through our GameStop, EB Games and Micromania stores. We sell mobile and consumer electronics
primarily through our Spring Mobile and Simply Mac stores. Our stores, which totaled 6,675 at February 1, 2014, are located in
major regional shopping malls and strip centers. We also operate electronic commerce Web sites at www.gamestop.com,
www.ebgames.com.au, www.ebgames.co.nz, www.gamestop.ca, www.gamestop.it, www.gamestop.es, www.gamestop.ie,
www.gamestop.de, www.gamestop.co.uk and www.micromania.fr. In addition, we publish Game Informer magazine, operate the
online video gaming Web site www.kongregate.com, a digital PC game distribution platform available at www.gamestop.com/
pcgames, iOS and Android mobile applications and an online consumer electronics marketplace available at
www.buymytronics.com. We operate our business in four Video Game Brands segments: United States, Canada, Australia and
Europe, and a Technology Brands segment, which was added in the fourth quarter of fiscal 2013 and includes the operations of
our Spring Mobile, Simply Mac, and Aio Wireless businesses.
Our largest vendors worldwide are Sony Computer Entertainment, Microsoft, Nintendo, Electronic Arts, Inc. and Activision,
which accounted for 20%, 15%, 12%, 10% and 10%, respectively, of our new product purchases in fiscal 2013, 17%, 13%, 14%,
11% and 16%, respectively, in fiscal 2012 and 15%, 17%, 16%, 13% and 11%, respectively, in fiscal 2011. In addition, Take-Two
Interactive accounted for 11% of our new product purchases in fiscal 2013.
Basis of Presentation and Consolidation
Our consolidated financial statements include our accounts and the accounts of our wholly-owned subsidiaries and our
majority-owned subsidiaries. All intercompany accounts and transactions have been eliminated in consolidation. All dollar and
share amounts (other than dollar amounts per share) in the consolidated financial statements are stated in millions unless otherwise
indicated.
Our fiscal year is composed of the 52 or 53 weeks ending on the Saturday closest to the last day of January. Fiscal 2013
consisted of the 52 weeks ended on February 1, 2014. Fiscal 2012 consisted of the 53 weeks ended on February 2, 2013. Fiscal
2011 consisted of the 52 weeks ended on January 28, 2012.
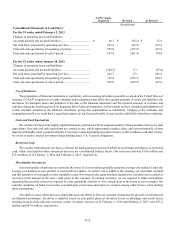
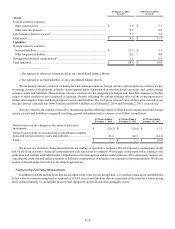
We have revised the presentation of outstanding checks in our prior period financial statements. Previously, we reduced cash
and liabilities when the checks were presented for payment and cleared our bank accounts. As of February 1, 2014, we reduce
cash and liabilities when the checks are released for payment.
The impacts of revising our financial statements for the specified prior periods are as follows:
As Previously
Reported Revision As Revised
(In millions)
Consolidated Balance Sheets:
As of February 2, 2013
Cash and cash equivalents .............................................................. $ 635.8 $ (261.4) $ 374.4
Total current assets ......................................................................... 2,010.9 (261.4) 1,749.5
Total assets...................................................................................... 4,133.6 (261.4) 3,872.2
Accounts payable............................................................................ 870.9 (259.3) 611.6
Accrued liabilities........................................................................... 741.0 (2.1) 738.9
Total current liabilities.................................................................... 1,715.3 (261.4) 1,453.9
Total liabilities................................................................................ 1,847.3 (261.4) 1,585.9