GameStop 2013 Annual Report Download - page 106
Download and view the complete annual report
Please find page 106 of the 2013 GameStop annual report below. You can navigate through the pages in the report by either clicking on the pages listed below, or by using the keyword search tool below to find specific information within the annual report.-
 1
1 -
2
-
3
-
4
-
5
-
6
-
7
-
8
-
9
-
10
-
11
-
12
-
13
-
14
-
15
-
16
-
17
-
18
-
19
-
20
-
21
-
22
-
23
-
24
-
25
-
26
-
27
-
28
-
29
-
30
-
31
-
32
-
33
-
34
-
35
-
36
-
37
-
38
-
39
-
40
-
41
-
42
-
43
-
44
-
45
-
46
-
47
-
48
-
49
-
50
-
51
-
52
-
53
-
54
-
55
-
56
-
57
-
58
-
59
-
60
-
61
-
62
-
63
-
64
-
65
-
66
-
67
-
68
-
69
-
70
-
71
-
72
-
73
-
74
-
75
-
76
-
77
-
78
-
79
-
80
-
81
-
82
-
83
-
84
-
85
-
86
-
87
-
88
-
89
-
90
-
91
-
92
-
93
-
94
-
95
-
 96
96 -
 97
97 -
 98
98 -
 99
99 -
 100
100 -
 101
101 -
 102
102 -
 103
103 -
 104
104 -
 105
105 -
 106
106 -
 107
107 -
 108
108 -
 109
109 -
 110
110 -
 111
111 -
 112
112 -
 113
113
 |
 |

F-33
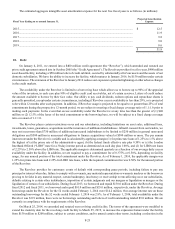
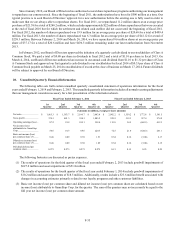
As of and for the Fiscal Year Ended February 2,
2013
United
States Canada Australia Europe
Technology
Brands Consolidated
Net sales......................................................... $ 6,192.4 $ 478.4 $ 607.3 $ 1,608.6 $ — $ 8,886.7
Segment operating earnings (loss)................. 501.9 (74.4)(71.6)(397.5)—(41.6)
Interest income .............................................. 0.9
Interest expense ............................................. (4.2)
Loss before income taxes .............................. (44.9)
Other Information:
Goodwill ........................................................ 1,153.5 37.7 96.6 95.3 — 1,383.1
Other long-lived assets .................................. 375.4 21.0 52.1 291.1 — 739.6
Total assets..................................................... 2,404.0 252.2 416.6 799.4 — 3,872.2
Income tax expense ....................................... 199.8 7.1 11.6 6.4 — 224.9
Depreciation and amortization ...................... 120.7 5.1 13.8 36.9 — 176.5
Capital expenditures ...................................... 101.8 3.6 9.2 25.0 — 139.6
As of and for the Fiscal Year Ended January 28,
2012
United
States Canada Australia Europe
Technology
Brands Consolidated
Net sales......................................................... $ 6,637.0 $ 498.4 $ 604.7 $ 1,810.4 $ — $ 9,550.5
Segment operating earnings .......................... 501.9 12.4 35.4 20.2 — 569.9
Interest income .............................................. 0.9
Interest expense ............................................. (20.7)
Debt extinguishment expense........................ (1.0)
Earnings before income taxes........................ 549.1
Other Information:
Goodwill ........................................................ 1,152.0 137.4 210.0 519.6 — 2,019.0
Other long-lived assets .................................. 404.0 23.0 58.3 345.8 — 831.1
Total assets..................................................... 2,479.0 350.8 513.3 1,265.1 — 4,608.2
Income tax expense ....................................... 197.4 4.2 11.7 (2.7) — 210.6
Depreciation and amortization ...................... 126.4 6.1 12.4 41.4 — 186.3
Capital expenditures ...................................... 108.7 3.2 24.4 28.8 — 165.1