Comcast 2011 Annual Report Download - page 98
Download and view the complete annual report
Please find page 98 of the 2011 Comcast annual report below. You can navigate through the pages in the report by either clicking on the pages listed below, or by using the keyword search tool below to find specific information within the annual report.-
 1
1 -
2
-
3
-
4
-
5
-
6
-
7
-
8
-
9
-
10
-
11
-
12
-
13
-
14
-
15
-
16
-
17
-
18
-
19
-
20
-
21
-
22
-
23
-
24
-
25
-
26
-
27
-
28
-
29
-
30
-
31
-
32
-
33
-
34
-
35
-
36
-
37
-
38
-
39
-
40
-
41
-
42
-
43
-
44
-
45
-
46
-
47
-
48
-
49
-
50
-
51
-
52
-
53
-
54
-
55
-
56
-
57
-
58
-
59
-
60
-
61
-
62
-
63
-
64
-
65
-
66
-
67
-
68
-
69
-
70
-
71
-
72
-
73
-
74
-
75
-
76
-
77
-
78
-
79
-
80
-
81
-
82
-
83
-
84
-
85
-
86
-
87
-
 88
88 -
 89
89 -
 90
90 -
 91
91 -
 92
92 -
 93
93 -
 94
94 -
 95
95 -
 96
96 -
 97
97 -
 98
98 -
 99
99 -
 100
100 -
 101
101 -
 102
102 -
 103
103 -
 104
104 -
 105
105 -
 106
106 -
 107
107 -
 108
108 -
109
-
110
-
111
-
112
-
113
-
114
-
115
-
116
-
117
-
118
-
119
-
120
-
121
-
122
-
123
-
124
-
125
-
126
-
127
-
128
-
129
-
130
-
131
-
132
-
133
-
134
-
135
-
136
-
137
-
138
-
139
-
140
-
141
-
142
-
143
-
144
-
145
-
146
-
147
-
148
 |
 |

ments, and is not necessarily indicative of what our results would have been had we operated the businesses
since January 1, 2010. No pro forma adjustments have been made for our incremental transaction-related
expenses.
Year ended December 31 (in millions except per share amounts) 2011 2010
Revenue $ 57,661 $ 55,054
Net income from consolidated operations $ 5,169 $ 4,584
Net income attributable to Comcast Corporation $ 4,149 $ 3,844
Basic earnings per common share attributable to Comcast Corporation shareholders $ 1.51 $ 1.37
Diluted earnings per common share attributable to Comcast Corporation shareholders $ 1.49 $ 1.36
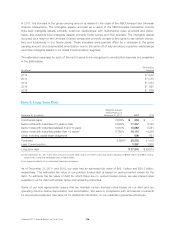
Note 5: Film and Television Costs
December 31 (in millions) 2011 2010
Film Costs:
Released, less amortization $ 1,428 $—
Completed, not released 148 —
In-production and in-development 1,374 —
2,950 —
Television Costs:
Released, less amortization 1,002 94
In-production and in-development 201 43
1,203 137
Programming rights, less amortization 2,061 445
6,214 582
Less: Current portion of programming rights 987 122
Film and television costs $ 5,227 $ 460
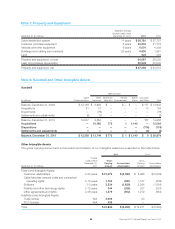
Based on management’s estimates of ultimate revenue as of December 31, 2011, approximately $896 million
of film and television costs associated with our original film and television productions that are released, or
completed and not yet released, are expected to be amortized during 2012. Approximately 89% of
unamortized film and television costs for our released productions, excluding amounts allocated to acquired
libraries, are expected to be amortized through 2014.
As of December 31, 2011, acquired film and television libraries, which are included within Released, less
amortization in the table above, had remaining unamortized costs of approximately $1.0 billion. These costs
are generally amortized over a period not to exceed 20 years, and approximately 43% of these costs are
expected to be amortized through 2014.
Comcast 2011 Annual Report on Form 10-K 96