Comcast 2011 Annual Report Download - page 79
Download and view the complete annual report
Please find page 79 of the 2011 Comcast annual report below. You can navigate through the pages in the report by either clicking on the pages listed below, or by using the keyword search tool below to find specific information within the annual report.-
 1
1 -
2
-
3
-
4
-
5
-
6
-
7
-
8
-
9
-
10
-
11
-
12
-
13
-
14
-
15
-
16
-
17
-
18
-
19
-
20
-
21
-
22
-
23
-
24
-
25
-
26
-
27
-
28
-
29
-
30
-
31
-
32
-
33
-
34
-
35
-
36
-
37
-
38
-
39
-
40
-
41
-
42
-
43
-
44
-
45
-
46
-
47
-
48
-
49
-
50
-
51
-
52
-
53
-
54
-
55
-
56
-
57
-
58
-
59
-
60
-
61
-
62
-
63
-
64
-
65
-
66
-
67
-
68
-
 69
69 -
 70
70 -
 71
71 -
 72
72 -
 73
73 -
 74
74 -
 75
75 -
 76
76 -
 77
77 -
 78
78 -
 79
79 -
 80
80 -
 81
81 -
 82
82 -
 83
83 -
 84
84 -
 85
85 -
 86
86 -
 87
87 -
 88
88 -
 89
89 -
90
-
91
-
92
-
93
-
94
-
95
-
96
-
97
-
98
-
99
-
100
-
101
-
102
-
103
-
104
-
105
-
106
-
107
-
108
-
109
-
110
-
111
-
112
-
113
-
114
-
115
-
116
-
117
-
118
-
119
-
120
-
121
-
122
-
123
-
124
-
125
-
126
-
127
-
128
-
129
-
130
-
131
-
132
-
133
-
134
-
135
-
136
-
137
-
138
-
139
-
140
-
141
-
142
-
143
-
144
-
145
-
146
-
147
-
148
 |
 |

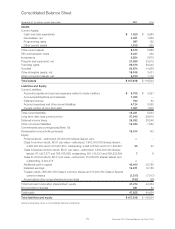
Consolidated Balance Sheet
December 31 (in millions, except share data) 2011 2010
Assets
Current Assets:
Cash and cash equivalents $ 1,620 $ 5,984
Receivables, net 4,351 1,855
Programming rights 987 122
Other current assets 1,615 925
Total current assets 8,573 8,886
Film and television costs 5,227 460
Investments 9,854 6,670
Property and equipment, net 27,559 23,515
Franchise rights 59,376 59,442
Goodwill 26,874 14,958
Other intangible assets, net 18,165 3,431
Other noncurrent assets, net 2,190 1,172
Total assets $ 157,818 $ 118,534
Liabilities and Equity
Current Liabilities:
Accounts payable and accrued expenses related to trade creditors $ 5,705 $ 3,291
Accrued participations and residuals 1,255 —
Deferred revenue 790 83
Accrued expenses and other current liabilities 4,124 3,060
Current portion of long-term debt 1,367 1,800
Total current liabilities 13,241 8,234
Long-term debt, less current portion 37,942 29,615
Deferred income taxes 29,932 28,246
Other noncurrent liabilities 13,034 7,862
Commitments and contingencies (Note 19)
Redeemable noncontrolling interests 16,014 143
Equity:
Preferred stock—authorized, 20,000,000 shares; issued, zero ——
Class A common stock, $0.01 par value—authorized, 7,500,000,000 shares; issued,
2,460,937,253 and 2,437,281,651; outstanding, 2,095,476,503 and 2,071,820,901 25 24
Class A Special common stock, $0.01 par value—authorized, 7,500,000,000 shares;
issued, 671,947,577 and 766,168,658; outstanding, 601,012,813 and 695,233,894 78
Class B common stock, $0.01 par value—authorized, 75,000,000 shares; issued and
outstanding, 9,444,375 ——
Additional paid-in capital 40,940 39,780
Retained earnings 13,971 12,158
Treasury stock, 365,460,750 Class A common shares and 70,934,764 Class A Special
common shares (7,517) (7,517)
Accumulated other comprehensive income (loss) (152) (99)
Total Comcast Corporation shareholders’ equity 47,274 44,354
Noncontrolling interests 381 80
Total equity 47,655 44,434
Total liabilities and equity $ 157,818 $ 118,534
See accompanying notes to consolidated financial statements.
77 Comcast 2011 Annual Report on Form 10-K