Comcast 2011 Annual Report Download - page 57
Download and view the complete annual report
Please find page 57 of the 2011 Comcast annual report below. You can navigate through the pages in the report by either clicking on the pages listed below, or by using the keyword search tool below to find specific information within the annual report.-
 1
1 -
2
-
3
-
4
-
5
-
6
-
7
-
8
-
9
-
10
-
11
-
12
-
13
-
14
-
15
-
16
-
17
-
18
-
19
-
20
-
21
-
22
-
23
-
24
-
25
-
26
-
27
-
28
-
29
-
30
-
31
-
32
-
33
-
34
-
35
-
36
-
37
-
38
-
39
-
40
-
41
-
42
-
43
-
44
-
45
-
46
-
 47
47 -
 48
48 -
 49
49 -
 50
50 -
 51
51 -
 52
52 -
 53
53 -
 54
54 -
 55
55 -
 56
56 -
 57
57 -
 58
58 -
 59
59 -
 60
60 -
 61
61 -
 62
62 -
 63
63 -
 64
64 -
 65
65 -
 66
66 -
 67
67 -
68
-
69
-
70
-
71
-
72
-
73
-
74
-
75
-
76
-
77
-
78
-
79
-
80
-
81
-
82
-
83
-
84
-
85
-
86
-
87
-
88
-
89
-
90
-
91
-
92
-
93
-
94
-
95
-
96
-
97
-
98
-
99
-
100
-
101
-
102
-
103
-
104
-
105
-
106
-
107
-
108
-
109
-
110
-
111
-
112
-
113
-
114
-
115
-
116
-
117
-
118
-
119
-
120
-
121
-
122
-
123
-
124
-
125
-
126
-
127
-
128
-
129
-
130
-
131
-
132
-
133
-
134
-
135
-
136
-
137
-
138
-
139
-
140
-
141
-
142
-
143
-
144
-
145
-
146
-
147
-
148
 |
 |

Other
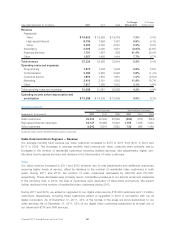
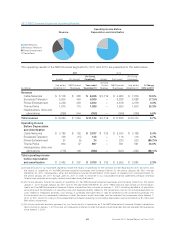
We also generate revenue from the licensing and sale of our owned programming. Pro forma combined other
revenue increased in 2011 primarily due to increases in the licensing of our owned content from our cable
production studio.
Cable Networks Segment — Operating Costs and Expenses
Our Cable Networks segment operating costs and expenses consist primarily of programming and production
expenses, advertising and marketing expenses, and other operating costs and expenses. Programming and
production expenses include the amortization of owned and acquired programming, direct production costs,
residual and participation payments, production overhead, and on-air talent costs. Advertising and marketing
expenses primarily consist of the costs incurred in promoting our cable networks, costs associated with digi-
tal media, and the costs of licensing our programming to third-party networks and other distribution
platforms. Other operating costs and expenses include salaries, employee benefits, rent and other overhead
expenses.
Our pro forma combined operating costs and expenses increased in 2011 primarily due to higher program-
ming and production expenses associated with an increase in the volume of original programming.
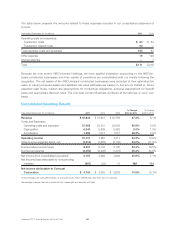
Cable Networks Segment — 2010 and 2009 Actual Results of Operations
During 2010 and 2009, the actual results of operations for our Cable Networks segment consisted of the
Comcast Content Business.
Year ended December 31 (in millions) 2010 2009
% Change
2009 to 2010
Revenue $ 2,719 $ 2,415 12.6%
Operating costs and expenses 1,987 1,809 9.8%
Operating income before depreciation and amortization $ 732 $ 606 20.8%
Cable Networks Segment — Revenue
Revenue increased in 2010 primarily due to similar increases in advertising revenue and distribution revenue.
In 2010 and 2009, approximately 12% of our Cable Networks segment revenue was generated from our
Cable Communications segment. These amounts are eliminated in our consolidated financial statements but
are included in the amounts presented above.
Cable Networks Segment — Operating Costs and Expenses
Operating costs and expenses in 2010 increased primarily due to higher programming and production
expenses.
55 Comcast 2011 Annual Report on Form 10-K