Comcast 2011 Annual Report Download - page 50
Download and view the complete annual report
Please find page 50 of the 2011 Comcast annual report below. You can navigate through the pages in the report by either clicking on the pages listed below, or by using the keyword search tool below to find specific information within the annual report.-
 1
1 -
2
-
3
-
4
-
5
-
6
-
7
-
8
-
9
-
10
-
11
-
12
-
13
-
14
-
15
-
16
-
17
-
18
-
19
-
20
-
21
-
22
-
23
-
24
-
25
-
26
-
27
-
28
-
29
-
30
-
31
-
32
-
33
-
34
-
35
-
36
-
37
-
38
-
39
-
 40
40 -
 41
41 -
 42
42 -
 43
43 -
 44
44 -
 45
45 -
 46
46 -
 47
47 -
 48
48 -
 49
49 -
 50
50 -
 51
51 -
 52
52 -
 53
53 -
 54
54 -
 55
55 -
 56
56 -
 57
57 -
 58
58 -
 59
59 -
 60
60 -
61
-
62
-
63
-
64
-
65
-
66
-
67
-
68
-
69
-
70
-
71
-
72
-
73
-
74
-
75
-
76
-
77
-
78
-
79
-
80
-
81
-
82
-
83
-
84
-
85
-
86
-
87
-
88
-
89
-
90
-
91
-
92
-
93
-
94
-
95
-
96
-
97
-
98
-
99
-
100
-
101
-
102
-
103
-
104
-
105
-
106
-
107
-
108
-
109
-
110
-
111
-
112
-
113
-
114
-
115
-
116
-
117
-
118
-
119
-
120
-
121
-
122
-
123
-
124
-
125
-
126
-
127
-
128
-
129
-
130
-
131
-
132
-
133
-
134
-
135
-
136
-
137
-
138
-
139
-
140
-
141
-
142
-
143
-
144
-
145
-
146
-
147
-
148
 |
 |

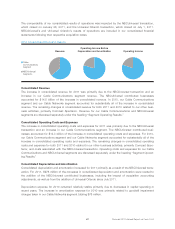
Segment Operating Results
Beginning in the first quarter of 2011, we changed our reporting segments as a result of the close of the
NBCUniversal transaction. We have recast our segment presentation for 2010 and 2009 to reflect our current
operating segments.
Our segment operating results are presented based on how we assess operating performance and internally
report financial information. We use operating income (loss) before depreciation and amortization, excluding
impairments related to fixed and intangible assets and gains or losses from the sale of assets, if any, as the
measure of profit or loss for our operating segments. This measure eliminates the significant level of noncash
depreciation and amortization expense that results from the capital-intensive nature of certain of our busi-
nesses and from intangible assets recognized in business combinations. Additionally, it is unaffected by our
capital structure or investment activities. We use this measure to evaluate our consolidated operating
performance and the operating performance of our operating segments and to allocate resources and capital
to our operating segments. It is also a significant performance measure in our annual incentive compensation
programs. We believe that this measure is useful to investors because it is one of the bases for comparing
our operating performance with that of other companies in our industries, although our measure may not be
directly comparable to similar measures used by other companies. Because we use operating income (loss)
before depreciation and amortization to measure our segment profit or loss, we reconcile it to operating
income, the most directly comparable financial measure calculated and presented in accordance with gen-
erally accepted accounting principles in the United States (“GAAP”) in the business segment footnote to our
consolidated financial statements (see Note 20 to our consolidated financial statements). This measure
should not be considered a substitute for operating income (loss), net income (loss) attributable to Comcast
Corporation, net cash provided by operating activities, or other measures of performance or liquidity we have
reported in accordance with GAAP.
Competition
The results of operations of our reporting segments may be affected by competition, as all of our businesses
operate in intensely competitive industries and compete with a growing number of companies that provide a
broad range of communications products and services and entertainment, news and information content to
consumers. Technological changes are further intensifying and complicating the competitive landscape, as
companies continue to emerge that offer services or devices that enable Internet video streaming and down-
loading of movies, television shows and other video programming and as wireless services and devices
continue to evolve. Moreover, newer services that distribute video programming are also beginning to pro-
duce or acquire their own original content. This competition is further complicated by federal and state
legislative bodies and various regulatory agencies, such as the FCC, which can adopt laws and policies that
provide a favorable operating environment for some of our existing and potential new competitors. See
“Business – Competition” for additional information.
Seasonality and Cyclicality
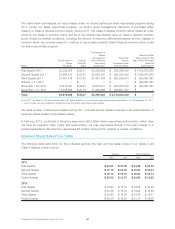
Each of our businesses is subject to seasonal and cyclical variations. In our Cable Communications segment,
our results are impacted by the seasonal nature of customers receiving our cable services in college and
vacation markets. This generally results in weaker customer metrics in the second calendar quarter.
Revenue in our Cable Communications, Cable Networks and Broadcast Television segments are subject to
cyclical advertising patterns and changes in viewership levels. Our U.S. advertising revenue is generally higher
in the second and fourth calendar quarters of each year, due in part to increases in consumer advertising in
the spring and in the period leading up to and including the holiday season. U.S. advertising revenue is also
cyclical, benefiting in even-numbered years from advertising related to candidates running for political office
and issue-oriented advertising. Broadcast Television revenue and operating costs and expenses also are
Comcast 2011 Annual Report on Form 10-K 48