Comcast 2011 Annual Report Download - page 51
Download and view the complete annual report
Please find page 51 of the 2011 Comcast annual report below. You can navigate through the pages in the report by either clicking on the pages listed below, or by using the keyword search tool below to find specific information within the annual report.-
 1
1 -
2
-
3
-
4
-
5
-
6
-
7
-
8
-
9
-
10
-
11
-
12
-
13
-
14
-
15
-
16
-
17
-
18
-
19
-
20
-
21
-
22
-
23
-
24
-
25
-
26
-
27
-
28
-
29
-
30
-
31
-
32
-
33
-
34
-
35
-
36
-
37
-
38
-
39
-
40
-
 41
41 -
 42
42 -
 43
43 -
 44
44 -
 45
45 -
 46
46 -
 47
47 -
 48
48 -
 49
49 -
 50
50 -
 51
51 -
 52
52 -
 53
53 -
 54
54 -
 55
55 -
 56
56 -
 57
57 -
 58
58 -
 59
59 -
 60
60 -
 61
61 -
62
-
63
-
64
-
65
-
66
-
67
-
68
-
69
-
70
-
71
-
72
-
73
-
74
-
75
-
76
-
77
-
78
-
79
-
80
-
81
-
82
-
83
-
84
-
85
-
86
-
87
-
88
-
89
-
90
-
91
-
92
-
93
-
94
-
95
-
96
-
97
-
98
-
99
-
100
-
101
-
102
-
103
-
104
-
105
-
106
-
107
-
108
-
109
-
110
-
111
-
112
-
113
-
114
-
115
-
116
-
117
-
118
-
119
-
120
-
121
-
122
-
123
-
124
-
125
-
126
-
127
-
128
-
129
-
130
-
131
-
132
-
133
-
134
-
135
-
136
-
137
-
138
-
139
-
140
-
141
-
142
-
143
-
144
-
145
-
146
-
147
-
148
 |
 |

cyclical as a result of our periodic broadcasts of the Olympic Games and Super Bowls. Our advertising rev-
enue generally increases in the period of these broadcasts from increased demand for advertising time, and
our operating costs and expenses also increase as a result of our production costs and amortization of the
related rights fees. Our results of operations and cash flows may be negatively impacted if the amount of
advertising revenue generated does not exceed the associated costs of broadcasting such events.
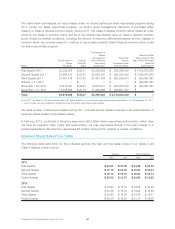
Revenue in our Cable Networks, Broadcast Television and Filmed Entertainment segments also fluctuates
due to the timing and performance of theatrical, home entertainment and television releases. Release dates
are determined by several factors, including competition and the timing of vacation and holiday periods. As a
result, revenue tends to be seasonal, with increases experienced during the summer months, around holidays
and in the fourth calendar quarter of each year. Revenue in our Cable Networks, Broadcast Television and
Filmed Entertainment segments also fluctuates due to the timing of when our owned content is made avail-
able to licensees.
Revenue in our Theme Parks segment fluctuates with changes in theme park attendance resulting from the
seasonal nature of vacation travel, local entertainment offerings and seasonal weather variations. Our theme
parks experience peak attendance generally during the summer months when schools are closed and during
early winter and spring holiday periods.
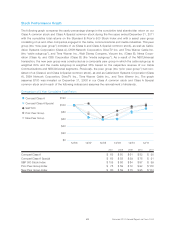
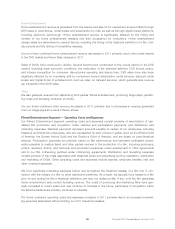
Cable Communications Segment — Results of Operations
$15.3
Revenue and Operating Income
Before Depreciation and Amortization
(in billions)
Revenue
Operating Income
Before Depreciation
and Amortization
2009 2011
$37.2
$14.3
2010
$35.4
$13.5
$33.5
40.1% 40.4% 41.1%
Operating Margin
49 Comcast 2011 Annual Report on Form 10-K