Comcast 2011 Annual Report Download - page 130
Download and view the complete annual report
Please find page 130 of the 2011 Comcast annual report below. You can navigate through the pages in the report by either clicking on the pages listed below, or by using the keyword search tool below to find specific information within the annual report.
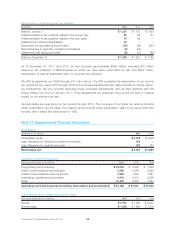
Condensed Consolidating Balance Sheet
December 31, 2010
(in millions)
Comcast
Parent
CCCL
Parent
Combined
CCHMO
Parents
Comcast
Holdings
Non-
Guarantor
Subsidiaries
Elimination
and
Consolidation
Adjustments
Consolidated
Comcast
Corporation
Assets
Cash and cash equivalents $ — $ — $ — $ — $ 5,984 $ — $ 5,984
Receivables, net ————1,855 — 1,855
Programming rights ————122 —122
Other current assets 162 — — — 763 — 925
Total current assets 162 — — — 8,724 — 8,886
Film and television costs ————460 —460
Investments ————6,670 — 6,670
Investments in and amounts due from
subsidiaries eliminated upon
consolidation 68,987 90,076 52,652 72,629 12,339 (296,683) —
Property and equipment, net 278 — — — 23,237 — 23,515
Franchise rights ————59,442 — 59,442
Goodwill ————14,958 — 14,958
Other intangible assets, net 10 — — — 3,421 — 3,431
Other noncurrent assets, net 1,128 45 — 148 670 (819) 1,172
Total assets $ 70,565 $ 90,121 $ 52,652 $ 72,777 $ 129,921 $ (297,502) $ 118,534
Liabilities and Equity
Accounts payable and accrued
expenses related
to trade creditors $ 6 $ 3 $ — $ — $ 3,282 $ — $ 3,291
Accrued expenses and other
current liabilities 1,038 187 74 266 1,578 — 3,143
Current portion of long-term debt 755 1,000 — — 45 — 1,800
Total current liabilities 1,799 1,190 74 266 4,905 — 8,234
Long-term debt, less current portion 22,754 3,963 2,339 310 249 — 29,615
Deferred income taxes — — — 704 28,218 (676) 28,246
Other noncurrent liabilities 1,658 — — — 6,347 (143) 7,862
Redeemable noncontrolling interests ————143 —143
Equity:
Common stock 32 — — — — — 32
Other shareholders’ equity 44,322 84,968 50,239 71,497 89,979 (296,683) 44,322
Total Comcast Corporation
shareholders’ equity 44,354 84,968 50,239 71,497 89,979 (296,683) 44,354
Noncontrolling interests ———— 80 — 80
Total equity 44,354 84,968 50,239 71,497 90,059 (296,683) 44,434
Total liabilities and equity $ 70,565 $ 90,121 $ 52,652 $ 72,777 $ 129,921 $ (297,502) $ 118,534
Comcast 2011 Annual Report on Form 10-K 128


