Comcast 2011 Annual Report Download - page 55
Download and view the complete annual report
Please find page 55 of the 2011 Comcast annual report below. You can navigate through the pages in the report by either clicking on the pages listed below, or by using the keyword search tool below to find specific information within the annual report.-
 1
1 -
2
-
3
-
4
-
5
-
6
-
7
-
8
-
9
-
10
-
11
-
12
-
13
-
14
-
15
-
16
-
17
-
18
-
19
-
20
-
21
-
22
-
23
-
24
-
25
-
26
-
27
-
28
-
29
-
30
-
31
-
32
-
33
-
34
-
35
-
36
-
37
-
38
-
39
-
40
-
41
-
42
-
43
-
44
-
 45
45 -
 46
46 -
 47
47 -
 48
48 -
 49
49 -
 50
50 -
 51
51 -
 52
52 -
 53
53 -
 54
54 -
 55
55 -
 56
56 -
 57
57 -
 58
58 -
 59
59 -
 60
60 -
 61
61 -
 62
62 -
 63
63 -
 64
64 -
 65
65 -
66
-
67
-
68
-
69
-
70
-
71
-
72
-
73
-
74
-
75
-
76
-
77
-
78
-
79
-
80
-
81
-
82
-
83
-
84
-
85
-
86
-
87
-
88
-
89
-
90
-
91
-
92
-
93
-
94
-
95
-
96
-
97
-
98
-
99
-
100
-
101
-
102
-
103
-
104
-
105
-
106
-
107
-
108
-
109
-
110
-
111
-
112
-
113
-
114
-
115
-
116
-
117
-
118
-
119
-
120
-
121
-
122
-
123
-
124
-
125
-
126
-
127
-
128
-
129
-
130
-
131
-
132
-
133
-
134
-
135
-
136
-
137
-
138
-
139
-
140
-
141
-
142
-
143
-
144
-
145
-
146
-
147
-
148
 |
 |

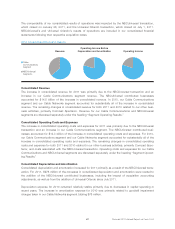
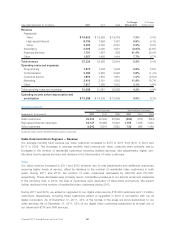
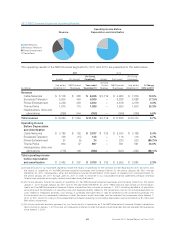
2011 NBCUniversal Segments Operating Results
Revenue
Cable Networks
Broadcast Television
Filmed Entertainment
Theme Parks
Operating Income Before
Depreciation and Amortization
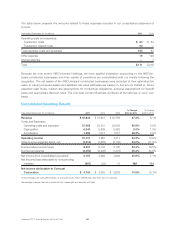
The operating results of the NBCUniversal segments for 2011 and 2010 are presented in the table below.
2011 2010
Actual(a) Pro Forma(b)
Pro Forma
Combined(c) Actual(a) Pro Forma(b)
Pro Forma
Combined(c)
(in millions)
Year ended
December 31
NBCUniversal
Businesses
Year ended
December 31
Comcast
Content
Business
NBCUniversal
Businesses
Year ended
December 31
% Change
2010 to 2011
Revenue
Cable Networks $ 8,108 $ 388 $ 8,496 $ 2,719 $ 4,960 $ 7,679 10.6%
Broadcast Television 5,935 464 6,399 — 6,888 6,888 (7.1)%
Filmed Entertainment 4,239 353 4,592 — 4,576 4,576 0.3%
Theme Parks 1,874 115 1,989 — 1,600 1,600 24.3%
Headquarters, other and
eliminations (896) 544 (352) — (369) (369) 4.8%
Total revenue $ 19,260 $ 1,864 $ 21,124 $ 2,719 $ 17,655 $ 20,374 3.7%
Operating Income
Before Depreciation
and Amortization
Cable Networks $ 3,185 $ 152 $ 3,337 $ 732 $ 2,434 $ 3,166 5.4%
Broadcast Television 138 (15) 123 — 118 118 4.7%
Filmed Entertainment 27 (3) 24 — 230 230 (89.7)%
Theme Parks 830 37 867 — 591 591 46.6%
Headquarters, other and
eliminations (718) 136 (582) — (421) (421) (38.1)%
Total operating income
before depreciation
and amortization $ 3,462 $ 307 $ 3,769 $ 732 $ 2,952 $ 3,684 2.3%
(a) Actual amounts for our reportable segments include the results of operations for the Comcast Content Business for 2011 and 2010, and
the results of operations for the NBCUniversal acquired businesses and Universal Orlando for the period January 29, 2011 through
December 31, 2011. Headquarters, other and eliminations includes the elimination of the results of operations for Universal Orlando for
the period January 29, 2011 through June 30, 2011 in order to reconcile to our consolidated financial statements because Universal
Orlando was recorded as an equity method investment during that period.
(b) Pro forma amounts include the results of operations for the NBCUniversal acquired businesses and Universal Orlando for the period
January 1, 2011 through January 28, 2011 and for the year ended December 31, 2010. These amounts also include pro forma adjust-
ments as if the NBCUniversal and Universal Orlando transactions had occurred on January 1, 2010, including the effects of acquisition
accounting and the elimination of operating costs and expenses directly related to the transactions, but do not include adjustments for
costs related to integration activities, cost savings or synergies that have been or may be achieved by the combined businesses. Pro
forma amounts are not necessarily indicative of what the results would have been had we operated the businesses since January 1,
2010. In 2011 and 2010, total pro forma adjustments increased operating income before depreciation and amortization by $7 million and
$36 million, respectively.
(c) Pro forma combined amounts represent our pro forma results of operations as if the NBCUniversal and Universal Orlando transactions
had occurred on January 1, 2010 but are not necessarily indicative of what the results would have been had we operated the businesses
since January 1, 2010.
53 Comcast 2011 Annual Report on Form 10-K