Comcast 2011 Annual Report Download - page 126
Download and view the complete annual report
Please find page 126 of the 2011 Comcast annual report below. You can navigate through the pages in the report by either clicking on the pages listed below, or by using the keyword search tool below to find specific information within the annual report.-
 1
1 -
2
-
3
-
4
-
5
-
6
-
7
-
8
-
9
-
10
-
11
-
12
-
13
-
14
-
15
-
16
-
17
-
18
-
19
-
20
-
21
-
22
-
23
-
24
-
25
-
26
-
27
-
28
-
29
-
30
-
31
-
32
-
33
-
34
-
35
-
36
-
37
-
38
-
39
-
40
-
41
-
42
-
43
-
44
-
45
-
46
-
47
-
48
-
49
-
50
-
51
-
52
-
53
-
54
-
55
-
56
-
57
-
58
-
59
-
60
-
61
-
62
-
63
-
64
-
65
-
66
-
67
-
68
-
69
-
70
-
71
-
72
-
73
-
74
-
75
-
76
-
77
-
78
-
79
-
80
-
81
-
82
-
83
-
84
-
85
-
86
-
87
-
88
-
89
-
90
-
91
-
92
-
93
-
94
-
95
-
96
-
97
-
98
-
99
-
100
-
101
-
102
-
103
-
104
-
105
-
106
-
107
-
108
-
109
-
110
-
111
-
112
-
113
-
114
-
115
-
 116
116 -
 117
117 -
 118
118 -
 119
119 -
 120
120 -
 121
121 -
 122
122 -
 123
123 -
 124
124 -
 125
125 -
 126
126 -
 127
127 -
 128
128 -
 129
129 -
 130
130 -
 131
131 -
 132
132 -
 133
133 -
 134
134 -
 135
135 -
 136
136 -
137
-
138
-
139
-
140
-
141
-
142
-
143
-
144
-
145
-
146
-
147
-
148
 |
 |

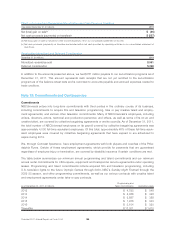
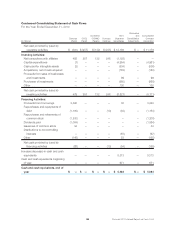
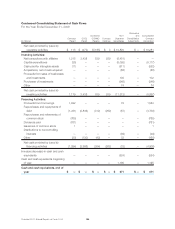
Note 20: Financial Data by Business Segment
Following the NBCUniversal transaction, we present our operations in five reportable segments; Cable
Communications, Cable Networks, Broadcast Television, Filmed Entertainment and Theme Parks. The
Comcast Content Business is presented with NBCUniversal’s businesses in the Cable Networks segment.
The businesses of Comcast Interactive Media (previously presented in Corporate and Other) that were not
contributed to NBCUniversal are included in the Cable Communications segment. We recast our segment
presentation for the years ended December 31, 2010 and 2009, in order to reflect our current reportable
segments. Operating income (loss) before depreciation and amortization for our Theme Parks segment
includes 100% of the results of operations of Universal Orlando for the period January 29, 2011 through
December 31, 2011, to reflect our current measure of operating performance for our Theme Parks segment.
SeeNote4foradditionalinformationontheNBCUniversal and Universal Orlando transactions. Our financial
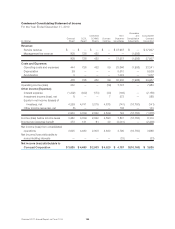
data by business segment is presented in the tables below.
(in millions) Revenue(f)
Operating
Income (Loss)
Before
Depreciation
and
Amortization(g)
Depreciation
and
Amortization
Operating
Income
(Loss)
Capital
Expenditures Assets(h)
2011
Cable Communications(a) $ 37,226 $ 15,288 $ 6,395 $ 8,893 $ 4,806 $ 120,729
NBCUniversal
Cable Networks(b) 8,108 3,185 718 2,467 48 29,578
Broadcast Television(c) 5,935 138 79 59 61 6,213
Filmed Entertainment(c) 4,239 27 20 7 6 3,891
Theme Parks(c) 1,874 830 146 684 154 6,197
Headquarters and Other(d) 45 (484) 168 (652) 165 5,443
Eliminations(e) (941) (234) 1 (235) — (538)
NBCUniversal 19,260 3,462 1,132 2,330 434 50,784
Corporate and Other(c) 558 (416) 93 (509) 67 6,224
Eliminations(e) (1,202) 23 16 7 — (19,919)
Comcast Consolidated $ 55,842 $ 18,357 $ 7,636 $ 10,721 $ 5,307 $ 157,818
(in millions) Revenue(f)
Operating
Income (Loss)
Before
Depreciation
and
Amortization(g)
Depreciation
and
Amortization
Operating
Income
(Loss)
Capital
Expenditures
2010
Cable Communications(a) $ 35,363 $ 14,302 $ 6,232 $ 8,070 $ 4,853
Cable Networks(b) 2,719 732 323 409 51
Corporate and Other(c) 168 (438) 61 (499) 57
Eliminations(e) (313) — — — —
Comcast Consolidated $ 37,937 $ 14,596 $ 6,616 $ 7,980 $ 4,961
Comcast 2011 Annual Report on Form 10-K 124