Comcast 2011 Annual Report Download - page 54
Download and view the complete annual report
Please find page 54 of the 2011 Comcast annual report below. You can navigate through the pages in the report by either clicking on the pages listed below, or by using the keyword search tool below to find specific information within the annual report.-
 1
1 -
2
-
3
-
4
-
5
-
6
-
7
-
8
-
9
-
10
-
11
-
12
-
13
-
14
-
15
-
16
-
17
-
18
-
19
-
20
-
21
-
22
-
23
-
24
-
25
-
26
-
27
-
28
-
29
-
30
-
31
-
32
-
33
-
34
-
35
-
36
-
37
-
38
-
39
-
40
-
41
-
42
-
43
-
 44
44 -
 45
45 -
 46
46 -
 47
47 -
 48
48 -
 49
49 -
 50
50 -
 51
51 -
 52
52 -
 53
53 -
 54
54 -
 55
55 -
 56
56 -
 57
57 -
 58
58 -
 59
59 -
 60
60 -
 61
61 -
 62
62 -
 63
63 -
 64
64 -
65
-
66
-
67
-
68
-
69
-
70
-
71
-
72
-
73
-
74
-
75
-
76
-
77
-
78
-
79
-
80
-
81
-
82
-
83
-
84
-
85
-
86
-
87
-
88
-
89
-
90
-
91
-
92
-
93
-
94
-
95
-
96
-
97
-
98
-
99
-
100
-
101
-
102
-
103
-
104
-
105
-
106
-
107
-
108
-
109
-
110
-
111
-
112
-
113
-
114
-
115
-
116
-
117
-
118
-
119
-
120
-
121
-
122
-
123
-
124
-
125
-
126
-
127
-
128
-
129
-
130
-
131
-
132
-
133
-
134
-
135
-
136
-
137
-
138
-
139
-
140
-
141
-
142
-
143
-
144
-
145
-
146
-
147
-
148
 |
 |

customers and increase the number of delivery platforms, such as online and through our mobile applications
for smartphones and tablets; and as fees for retransmission of broadcast networks increase.
Technical Labor Expenses
Technical labor expenses include the internal and external labor costs to complete service call and installation
activities, as well as network operations, fulfillment and provisioning costs. These expenses remained rela-
tively stable in 2011 and 2010 due to improvements in our service call metrics and decreases in customer
activity.
Customer Service Expenses
Customer service expenses include the personnel and other costs associated with handling service calls and
customer support. Customer service expenses remained relatively stable in 2011. Customer service expenses
decreased in 2010 primarily due to operating efficiencies and due to higher levels of activity in 2009 related to
the transition by broadcasters from analog to digital transmission and our all digital conversion.
Marketing Expenses
Marketing expenses increased in 2011 and 2010 primarily due to increases in spending associated with the
continued expansion of business services and costs associated with the XFINITY®brand and competitive
marketing, and due to increases in direct sales efforts.
Other Costs and Expenses
Other operating costs and expenses include franchise fees, pole rentals, plant maintenance, vehicle-related
costs, advertising and representation fees, and expenses associated with our business services. These
expenses increased in 2011 and 2010 primarily due to the continued expansion of business services and
other service enhancement initiatives. During 2011, 2010 and 2009, we implemented personnel and cost
reduction programs that were focused on streamlining our Cable Communications operations. In connection
with these initiatives, during 2011, 2010 and 2009, we recorded $36 million, $66 million and $81 million,
respectively, of severance costs.
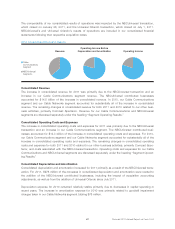
NBCUniversal Segments Overview
The discussion below compares the NBCUniversal segments’ pro forma combined results for 2011 and
2010, as well as our Cable Networks segment actual results for 2010 and 2009. Management believes review-
ing our operating results by combining actual and pro forma results for the NBCUniversal segments for 2011
and 2010 is more useful in identifying trends in, or reaching conclusions regarding, the overall operating per-
formance of these segments for the current year. Our pro forma segment information includes adjustments as
if the NBCUniversal and Universal Orlando transactions had occurred on January 1, 2010. Our pro forma data
was also adjusted for the effects of acquisition accounting and the elimination of costs and expenses directly
related to the transactions but does not include adjustments for costs related to integration activities, cost
savings or synergies that have been or may be achieved by the combined businesses. Pro forma amounts are
not necessarily indicative of what our results would have been had we operated the NBCUniversal con-
tributed businesses or Universal Orlando since January 1, 2010, nor of our future results.
Comcast 2011 Annual Report on Form 10-K 52