Comcast 2011 Annual Report Download - page 115
Download and view the complete annual report
Please find page 115 of the 2011 Comcast annual report below. You can navigate through the pages in the report by either clicking on the pages listed below, or by using the keyword search tool below to find specific information within the annual report.-
 1
1 -
2
-
3
-
4
-
5
-
6
-
7
-
8
-
9
-
10
-
11
-
12
-
13
-
14
-
15
-
16
-
17
-
18
-
19
-
20
-
21
-
22
-
23
-
24
-
25
-
26
-
27
-
28
-
29
-
30
-
31
-
32
-
33
-
34
-
35
-
36
-
37
-
38
-
39
-
40
-
41
-
42
-
43
-
44
-
45
-
46
-
47
-
48
-
49
-
50
-
51
-
52
-
53
-
54
-
55
-
56
-
57
-
58
-
59
-
60
-
61
-
62
-
63
-
64
-
65
-
66
-
67
-
68
-
69
-
70
-
71
-
72
-
73
-
74
-
75
-
76
-
77
-
78
-
79
-
80
-
81
-
82
-
83
-
84
-
85
-
86
-
87
-
88
-
89
-
90
-
91
-
92
-
93
-
94
-
95
-
96
-
97
-
98
-
99
-
100
-
101
-
102
-
103
-
104
-
 105
105 -
 106
106 -
 107
107 -
 108
108 -
 109
109 -
 110
110 -
 111
111 -
 112
112 -
 113
113 -
 114
114 -
 115
115 -
 116
116 -
 117
117 -
 118
118 -
 119
119 -
 120
120 -
 121
121 -
 122
122 -
 123
123 -
 124
124 -
 125
125 -
126
-
127
-
128
-
129
-
130
-
131
-
132
-
133
-
134
-
135
-
136
-
137
-
138
-
139
-
140
-
141
-
142
-
143
-
144
-
145
-
146
-
147
-
148
 |
 |

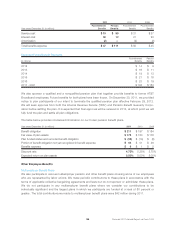
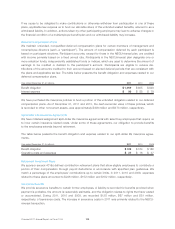
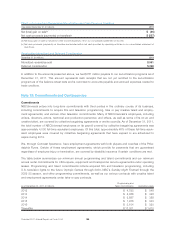
Recognized Share-Based Compensation Expense
Year ended December 31 (in millions) 2011 2010 2009
Stock options $ 116 $ 103 $ 103
Restricted share units 149 136 93
Employee stock purchase plans 13 12 13
Total $ 278 $ 251 $ 209
Tax benefit $98 $89 $73
As of December 31, 2011, we had unrecognized pretax compensation expense of $317 million related to
nonvested stock options and unrecognized pretax compensation expense of $327 million related to non-
vested RSUs that will be recognized over a weighted-average period of approximately 2.0 years and 1.8
years, respectively. The amount of share-based compensation capitalized was not material to our con-
solidated financial statements for the periods presented.
When stock options are exercised or RSU awards are settled through the issuance of shares, any income tax
benefit realized in excess of the amount previously recognized for financial reporting purposes associated
with compensation expense is presented as a financing activity rather than as an operating activity in our
consolidated statement of cash flows. In 2011 and 2010, the excess cash income tax benefit classified as a
financing cash inflow was approximately $46 million and $4 million, respectively. In 2009, there was no
excess cash income tax benefit classified as a financing cash inflow.
Option Plans
We maintain stock option plans for certain employees under which fixed-price stock options may be granted
and the option price is generally not less than the fair value of a share of the underlying stock on the date of
grant. Under our stock option plans, a combined total of approximately 241 million shares of our Class A and
Class A Special common stock are reserved for the exercise of stock options, including options outstanding
as of December 31, 2011. Option terms are generally 10 years, with options generally becoming exercisable
within 5 years from the date of grant.
We use the Black-Scholes option pricing model to estimate the fair value of each stock option on the date of
grant. The Black-Scholes option pricing model uses the assumptions summarized in the table below. Divi-
dend yield is based on the yield on the date of grant. Expected volatility is based on a blend of implied and
historical volatility of our Class A common stock. The risk-free rate is based on the U.S. Treasury yield curve
in effect on the date of grant. We use historical data on the exercise of stock options and other factors
expected to impact holders’ behavior to estimate the expected term of the options granted.
The table below presents the weighted-average fair value on the date of grant of a Class A common stock
option awarded under our stock option plans and the related weighted-average valuation assumptions.
2011 2010 2009
Fair value $ 6.96 $ 5.11 $ 4.93
Dividend yield 1.8% 2.1% 1.9%
Expected volatility 28.1% 28.0% 36.8%
Risk-free interest rate 2.8% 3.4% 2.4%
Expected option life (in years) 7.0 7.0 7.0
In 2007, we began granting net settled stock options instead of stock options exercised with a cash payment
(“cash settled stock options”). The change to net settled stock options results in fewer shares being issued
and no cash proceeds being received by us when a net settled option is exercised.
113 Comcast 2011 Annual Report on Form 10-K