Comcast 2011 Annual Report Download - page 66
Download and view the complete annual report
Please find page 66 of the 2011 Comcast annual report below. You can navigate through the pages in the report by either clicking on the pages listed below, or by using the keyword search tool below to find specific information within the annual report.-
 1
1 -
2
-
3
-
4
-
5
-
6
-
7
-
8
-
9
-
10
-
11
-
12
-
13
-
14
-
15
-
16
-
17
-
18
-
19
-
20
-
21
-
22
-
23
-
24
-
25
-
26
-
27
-
28
-
29
-
30
-
31
-
32
-
33
-
34
-
35
-
36
-
37
-
38
-
39
-
40
-
41
-
42
-
43
-
44
-
45
-
46
-
47
-
48
-
49
-
50
-
51
-
52
-
53
-
54
-
55
-
 56
56 -
 57
57 -
 58
58 -
 59
59 -
 60
60 -
 61
61 -
 62
62 -
 63
63 -
 64
64 -
 65
65 -
 66
66 -
 67
67 -
 68
68 -
 69
69 -
 70
70 -
 71
71 -
 72
72 -
 73
73 -
 74
74 -
 75
75 -
 76
76 -
77
-
78
-
79
-
80
-
81
-
82
-
83
-
84
-
85
-
86
-
87
-
88
-
89
-
90
-
91
-
92
-
93
-
94
-
95
-
96
-
97
-
98
-
99
-
100
-
101
-
102
-
103
-
104
-
105
-
106
-
107
-
108
-
109
-
110
-
111
-
112
-
113
-
114
-
115
-
116
-
117
-
118
-
119
-
120
-
121
-
122
-
123
-
124
-
125
-
126
-
127
-
128
-
129
-
130
-
131
-
132
-
133
-
134
-
135
-
136
-
137
-
138
-
139
-
140
-
141
-
142
-
143
-
144
-
145
-
146
-
147
-
148
 |
 |

forms. In most cases, the form of the arrangement involves the grant of an economic interest in a film to a
third-party investor. Investors generally assume the full risks and rewards of ownership proportionate to their
ownership in the film. We account for our proceeds as a reduction to our capitalized film cost, and the related
cash flows are a component of net cash provided by operating activities.
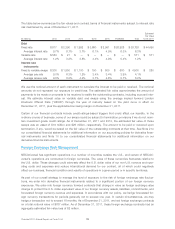
Operating Activities
Components of Net Cash Provided by Operating Activities
Year ended December 31 (in millions) 2011 2010 2009
Operating income $ 10,721 $ 7,980 $ 7,214
Depreciation and amortization 7,636 6,616 6,500
Operating income before depreciation and amortization 18,357 14,596 13,714
Noncash share-based compensation 344 300 257
Changes in operating assets and liabilities (603) (20) (450)
Cash basis operating income 18,098 14,876 13,521
Payments of interest (2,441) (1,983) (2,040)
Payments of income taxes (1,626) (1,864) (1,303)
Proceeds from interest, dividends and other nonoperating items 314 150 103
Net cash provided by operating activities $ 14,345 $ 11,179 $ 10,281
The changes in operating assets and liabilities in 2011 and 2010 primarily relate to the timing of payments of
operating items and payroll, and, in 2011 to an increase in film and television costs.
The increase in interest payments in 2011 was primarily due to an increase in our outstanding debt as a result
of the NBCUniversal transaction. The decrease in interest payments in 2010 was primarily due to the effects
of early extinguishment costs associated with the repayment in 2009 of certain of our debt obligations prior to
their maturity.
The decrease in income tax payments in 2011 was primarily due to the net income tax benefit in 2011 of the
2010 economic stimulus legislation. The increase in income tax payments in 2010 was primarily due to
increases in 2010 taxable income, partially offset by tax payments made in 2009 that related to prior years.
Investing Activities
Net cash used in investing activities consists primarily of cash paid for acquisitions, capital expenditures,
intangible assets and investments.
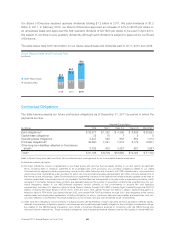
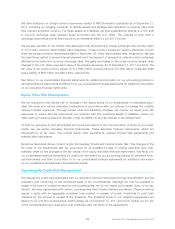
Capital Expenditures
Our most significant recurring investing activity has been capital expenditures in our Cable Communications
segment, and we expect that this will continue in the future. The table below summarizes the capital
expenditures we incurred in our Cable Communications segment from 2009 through 2011.
Year ended December 31 (in millions) 2011 2010 2009
Cable distribution system $ 1,715 $ 1,553 $ 1,570
Customer premises equipment 2,594 2,864 3,013
Vehicles and other equipment 446 388 399
Buildings and building improvements 51 48 48
Land ——1
Total $ 4,806 $ 4,853 $ 5,031
Comcast 2011 Annual Report on Form 10-K 64