Comcast 2011 Annual Report Download - page 59
Download and view the complete annual report
Please find page 59 of the 2011 Comcast annual report below. You can navigate through the pages in the report by either clicking on the pages listed below, or by using the keyword search tool below to find specific information within the annual report.-
 1
1 -
2
-
3
-
4
-
5
-
6
-
7
-
8
-
9
-
10
-
11
-
12
-
13
-
14
-
15
-
16
-
17
-
18
-
19
-
20
-
21
-
22
-
23
-
24
-
25
-
26
-
27
-
28
-
29
-
30
-
31
-
32
-
33
-
34
-
35
-
36
-
37
-
38
-
39
-
40
-
41
-
42
-
43
-
44
-
45
-
46
-
47
-
48
-
 49
49 -
 50
50 -
 51
51 -
 52
52 -
 53
53 -
 54
54 -
 55
55 -
 56
56 -
 57
57 -
 58
58 -
 59
59 -
 60
60 -
 61
61 -
 62
62 -
 63
63 -
 64
64 -
 65
65 -
 66
66 -
 67
67 -
 68
68 -
 69
69 -
70
-
71
-
72
-
73
-
74
-
75
-
76
-
77
-
78
-
79
-
80
-
81
-
82
-
83
-
84
-
85
-
86
-
87
-
88
-
89
-
90
-
91
-
92
-
93
-
94
-
95
-
96
-
97
-
98
-
99
-
100
-
101
-
102
-
103
-
104
-
105
-
106
-
107
-
108
-
109
-
110
-
111
-
112
-
113
-
114
-
115
-
116
-
117
-
118
-
119
-
120
-
121
-
122
-
123
-
124
-
125
-
126
-
127
-
128
-
129
-
130
-
131
-
132
-
133
-
134
-
135
-
136
-
137
-
138
-
139
-
140
-
141
-
142
-
143
-
144
-
145
-
146
-
147
-
148
 |
 |
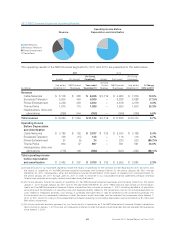
The licensing of our owned television programming after the initial network licensing is critical to the financial
success of a television series.
Our pro forma combined content licensing revenue increased in 2011 primarily due to the impact of licensing
agreements that we entered into during 2011, which included the licensing of certain prior season and library
content.
Other
Other revenue includes distribution revenue associated with the broadcast of the Olympic Games on our
Cable Networks. We also generate revenue from the sale of our owned programming on DVDs, through elec-
tronic sell-through and other formats, and from the licensing of our brands and characters for consumer
products. This revenue is driven primarily by the popularity of our broadcast networks and programming ser-
ies and, therefore, fluctuates based on consumer spending and acceptance.
Our pro forma combined other revenue decreased in 2011 primarily due to the absence of the 2010 Vancou-
ver Olympics and a decline in DVD sales.
Broadcast Television Segment — Operating Costs and Expenses
Our Broadcast Television segment operating costs and expenses consist primarily of programming and pro-
duction expenses, advertising and marketing expenses, and other operating costs and expenses.
Programming and production expenses relate to content originating on our broadcast networks and owned
local television stations and include the amortization of owned and acquired programming costs, direct pro-
duction costs, residual and participation payments, production overhead, and on-air talent costs. Advertising
and marketing expenses consist primarily of the costs incurred in promoting our owned television program-
ming, as well as the replication, distribution and marketing costs of DVDs, costs associated with digital
media, and the costs of licensing our programming to third parties and other distribution platforms. Other
operating costs and expenses include salaries, employee benefits, rent and other overhead expenses.
Our pro forma combined operating costs and expenses decreased in 2011 primarily due to $1 billion of pro-
gramming and production expenses recognized in 2010 associated with the 2010 Vancouver Olympics.
Excluding the impact of the 2010 Vancouver Olympics, operating costs and expenses increased in 2011
primarily due to higher programming and production expenses associated with a greater number of original
primetime series in 2011.
57 Comcast 2011 Annual Report on Form 10-K