Comcast 2011 Annual Report Download - page 102
Download and view the complete annual report
Please find page 102 of the 2011 Comcast annual report below. You can navigate through the pages in the report by either clicking on the pages listed below, or by using the keyword search tool below to find specific information within the annual report.-
 1
1 -
2
-
3
-
4
-
5
-
6
-
7
-
8
-
9
-
10
-
11
-
12
-
13
-
14
-
15
-
16
-
17
-
18
-
19
-
20
-
21
-
22
-
23
-
24
-
25
-
26
-
27
-
28
-
29
-
30
-
31
-
32
-
33
-
34
-
35
-
36
-
37
-
38
-
39
-
40
-
41
-
42
-
43
-
44
-
45
-
46
-
47
-
48
-
49
-
50
-
51
-
52
-
53
-
54
-
55
-
56
-
57
-
58
-
59
-
60
-
61
-
62
-
63
-
64
-
65
-
66
-
67
-
68
-
69
-
70
-
71
-
72
-
73
-
74
-
75
-
76
-
77
-
78
-
79
-
80
-
81
-
82
-
83
-
84
-
85
-
86
-
87
-
88
-
89
-
90
-
91
-
 92
92 -
 93
93 -
 94
94 -
 95
95 -
 96
96 -
 97
97 -
 98
98 -
 99
99 -
 100
100 -
 101
101 -
 102
102 -
 103
103 -
 104
104 -
 105
105 -
 106
106 -
 107
107 -
 108
108 -
 109
109 -
 110
110 -
 111
111 -
 112
112 -
113
-
114
-
115
-
116
-
117
-
118
-
119
-
120
-
121
-
122
-
123
-
124
-
125
-
126
-
127
-
128
-
129
-
130
-
131
-
132
-
133
-
134
-
135
-
136
-
137
-
138
-
139
-
140
-
141
-
142
-
143
-
144
-
145
-
146
-
147
-
148
 |
 |

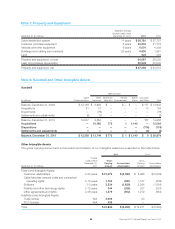
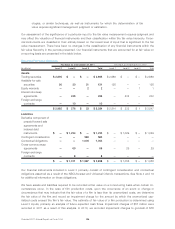
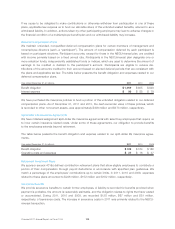
In 2011, the increase in the gross carrying amount is related to the close of the NBCUniversal and Universal
Orlando transactions. The intangible assets recorded as a result of the NBCUniversal transaction include
finite-lived intangible assets, primarily customer relationships with multichannel video providers and adver-
tisers, and indefinite-lived intangible assets, primarily trade names and FCC licenses. The intangible assets
recorded as a result of the Universal Orlando transaction primarily consist of the rights to use certain charac-
ters and trademarks in our theme parks. These increases were partially offset by a decrease in the gross
carrying amount and accumulated amortization due to the write-off of fully amortized customer relationships
and other intangible assets in our Cable Communication segment.
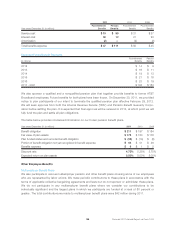
The estimated expenses for each of the next 5 years to be recognized in amortization expense are presented
in the table below.
(in millions)
Amortization
Expense
2012 $ 1,512
2013 $ 1,315
2014 $ 1,134
2015 $ 997
2016 $ 805
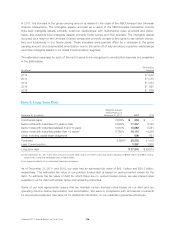
Note 9: Long-Term Debt
December 31 (in millions)
Weighted Average
Interest Rate as of
December 31, 2011 2011 2010
Commercial paper 0.508% $ 550 $—
Senior notes with maturities of 5 years or less 5.829% 11,347 8,145
Senior notes with maturities between 6 and 10 years 5.512% 10,689 8,381
Senior notes with maturities greater than 10 years(a) 6.780% 16,115 14,258
Other, including capital lease obligations — 608 631
Total debt 5.89%(b) 39,309 31,415
Less: Current portion 1,367 1,800
Long-term debt $ 37,942 $ 29,615
(a) The December 31, 2011 and 2010 amounts include £625 million of 5.50% notes due 2029 translated at $969 million and $976 million,
respectively, using the exchange rates at these dates.
(b) Includes the effects of our derivative financial instruments.
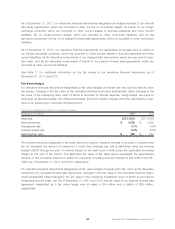
As of December 31, 2011 and 2010, our debt had an estimated fair value of $45.1 billion and $34.3 billion,
respectively. The estimated fair value of our publicly traded debt is based on quoted market values for the
debt. To estimate the fair value of debt for which there are no quoted market prices, we use interest rates
available to us for debt with similar terms and remaining maturities.
Some of our loan agreements require that we maintain certain financial ratios based on our debt and our
operating income before depreciation and amortization. We were in compliance with all financial covenants
for all periods presented. See Note 22 for additional information on our subsidiary guarantee structures.
Comcast 2011 Annual Report on Form 10-K 100