Comcast 2011 Annual Report Download - page 127
Download and view the complete annual report
Please find page 127 of the 2011 Comcast annual report below. You can navigate through the pages in the report by either clicking on the pages listed below, or by using the keyword search tool below to find specific information within the annual report.-
 1
1 -
2
-
3
-
4
-
5
-
6
-
7
-
8
-
9
-
10
-
11
-
12
-
13
-
14
-
15
-
16
-
17
-
18
-
19
-
20
-
21
-
22
-
23
-
24
-
25
-
26
-
27
-
28
-
29
-
30
-
31
-
32
-
33
-
34
-
35
-
36
-
37
-
38
-
39
-
40
-
41
-
42
-
43
-
44
-
45
-
46
-
47
-
48
-
49
-
50
-
51
-
52
-
53
-
54
-
55
-
56
-
57
-
58
-
59
-
60
-
61
-
62
-
63
-
64
-
65
-
66
-
67
-
68
-
69
-
70
-
71
-
72
-
73
-
74
-
75
-
76
-
77
-
78
-
79
-
80
-
81
-
82
-
83
-
84
-
85
-
86
-
87
-
88
-
89
-
90
-
91
-
92
-
93
-
94
-
95
-
96
-
97
-
98
-
99
-
100
-
101
-
102
-
103
-
104
-
105
-
106
-
107
-
108
-
109
-
110
-
111
-
112
-
113
-
114
-
115
-
116
-
 117
117 -
 118
118 -
 119
119 -
 120
120 -
 121
121 -
 122
122 -
 123
123 -
 124
124 -
 125
125 -
 126
126 -
 127
127 -
 128
128 -
 129
129 -
 130
130 -
 131
131 -
 132
132 -
 133
133 -
 134
134 -
 135
135 -
 136
136 -
 137
137 -
138
-
139
-
140
-
141
-
142
-
143
-
144
-
145
-
146
-
147
-
148
 |
 |

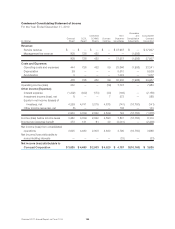
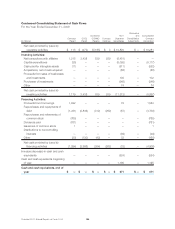
(in millions) Revenue(f)
Operating Income
(Loss) Before
Depreciation and
Amortization(g)
Depreciation
and
Amortization
Operating
Income
(Loss)
Capital
Expenditures
2009
Cable Communications(a) $ 33,544 $ 13,459 $ 6,199 $ 7,260 $ 5,031
Cable Networks(b) 2,415 606 278 328 55
Corporate and Other(c) 49 (351) 23 (374) 31
Eliminations(e) (252) — — — —
Comcast Consolidated $ 35,756 $ 13,714 $ 6,500 $ 7,214 $ 5,117
(a) Our Cable Communications segment consists primarily of our cable services business and the businesses of Comcast Interactive Media
that were not contributed to NBCUniversal.
For the years ended December 31, 2011, 2010 and 2009, Cable Communications segment revenue was derived from the following sour-
ces:
2011 2010 2009
Residential:
Video 52.7% 54.8% 57.5%
High-speed Internet 23.5% 22.5% 21.7%
Voice 9.4% 9.3% 9.2%
Advertising 5.4% 5.7% 4.8%
Business services 4.8% 3.6% 2.5%
Other 4.2% 4.1% 4.3%
Total 100% 100% 100%
Subscription revenue received from customers who purchase bundled services at a discounted rate is allocated proportionally to each
service based on the individual service’s price on a stand-alone basis. For 2011, 2010 and 2009, 2.8%, 2.8% and 2.5%, respectively, of
Cable Communications revenue was derived from franchise and other regulatory fees.
(b) For 2011, our Cable Networks segment consists primarily of NBCUniversal’s national cable networks, international cable networks, cable
television production studio and certain digital media properties, and the Comcast Content Business. For 2010 and 2009, our Cable
Networks segment consisted of the Comcast Content Business.
(c) See Note 1 for additional information on our segments.
(d) NBCUniversal Headquarters and Other activities include costs associated with overhead, allocations and employee benefits.
(e) Eliminations include the results of operations for Universal Orlando for the period January 29, 2011 through June 30, 2011. The Theme
Parks segment includes these amounts to reflect our current measure of operating performance for our Theme Parks segment but these
amounts are not included when we measure total NBCUniversal and our consolidated results of operations because we recorded Univer-
sal Orlando as an equity method investment in our consolidated financial statements during this period.
Also included in Eliminations are transactions that our segments enter into with one another. The most common types of transactions are
the following:
• our Cable Networks and Broadcast Television segments generate revenue by selling programming to our Cable Communications
segment, which represents a substantial majority of the revenue elimination amount
• our Cable Communications segment receives incentives offered by our Cable Networks segment in connection with its distribution
of the Cable Networks’ content that are recorded as a reduction to programming expenses
• our Cable Communications segment generates revenue by selling advertising and by selling the use of satellite feeds to our Cable
Networks segment
• our Filmed Entertainment and Broadcast Television segments generate revenue by licensing content to our Cable Networks seg-
ment
(f) Revenue from customers located outside of the U.S., primarily in Europe and Asia, for year ended December 31, 2011, was $4.1 billion.
Revenue from customers located outside of the U.S. was not significant for the years ended December 31, 2010 and 2009. No single
customer accounted for a significant amount of our revenue in any period.
(g) We use operating income (loss) before depreciation and amortization, excluding impairment charges related to fixed and intangible assets
and gains or losses from the sale of assets, if any, to measure the profit or loss of our operating segments. This measure eliminates the
significant level of noncash depreciation and amortization expense that results from the capital-intensive nature of certain of our busi-
nesses and from intangible assets recognized in business combinations. It is also unaffected by our capital structure or investment
activities. We use this measure to evaluate our consolidated operating performance, the operating performance of our operating seg-
ments and to allocate resources and capital to our operating segments. It is also a significant performance measure in our annual
incentive compensation programs. We believe that this measure is useful to investors because it is one of the bases for comparing our
operating performance with other companies in our industries, although our measure may not be directly comparable to similar measures
used by other companies. This measure should not be considered a substitute for operating income (loss), net income (loss) attributable
to Comcast Corporation, net cash provided by operating activities, or other measures of performance or liquidity reported in accordance
with GAAP.
(h) Property and equipment, net associated with operations located outside the U.S., primarily in Europe and Asia, was $60 million in 2011.
Property and equipment, net associated with operations located outside the U.S. was not significant in 2010.
125 Comcast 2011 Annual Report on Form 10-K