Comcast 2011 Annual Report Download - page 58
Download and view the complete annual report
Please find page 58 of the 2011 Comcast annual report below. You can navigate through the pages in the report by either clicking on the pages listed below, or by using the keyword search tool below to find specific information within the annual report.-
 1
1 -
2
-
3
-
4
-
5
-
6
-
7
-
8
-
9
-
10
-
11
-
12
-
13
-
14
-
15
-
16
-
17
-
18
-
19
-
20
-
21
-
22
-
23
-
24
-
25
-
26
-
27
-
28
-
29
-
30
-
31
-
32
-
33
-
34
-
35
-
36
-
37
-
38
-
39
-
40
-
41
-
42
-
43
-
44
-
45
-
46
-
47
-
 48
48 -
 49
49 -
 50
50 -
 51
51 -
 52
52 -
 53
53 -
 54
54 -
 55
55 -
 56
56 -
 57
57 -
 58
58 -
 59
59 -
 60
60 -
 61
61 -
 62
62 -
 63
63 -
 64
64 -
 65
65 -
 66
66 -
 67
67 -
 68
68 -
69
-
70
-
71
-
72
-
73
-
74
-
75
-
76
-
77
-
78
-
79
-
80
-
81
-
82
-
83
-
84
-
85
-
86
-
87
-
88
-
89
-
90
-
91
-
92
-
93
-
94
-
95
-
96
-
97
-
98
-
99
-
100
-
101
-
102
-
103
-
104
-
105
-
106
-
107
-
108
-
109
-
110
-
111
-
112
-
113
-
114
-
115
-
116
-
117
-
118
-
119
-
120
-
121
-
122
-
123
-
124
-
125
-
126
-
127
-
128
-
129
-
130
-
131
-
132
-
133
-
134
-
135
-
136
-
137
-
138
-
139
-
140
-
141
-
142
-
143
-
144
-
145
-
146
-
147
-
148
 |
 |

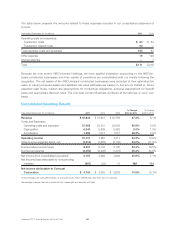
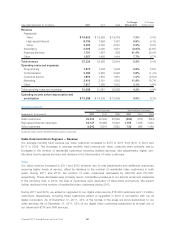
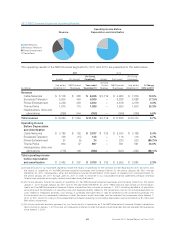
Broadcast Television Segment — Actual and Pro Forma Results of Operations
2011 2010
Actual(a) Pro Forma(b)
Pro Forma
Combined(c) Pro Forma(b)
(in millions)
For the period
January 29
through
December 31
For the period
January 1
through
January 28
Year ended
December 31
Year ended
December 31
% Change
2010 to 2011
Revenue
Advertising $ 3,941 $ 315 $ 4,256 $ 4,813 (11.6)%
Content licensing 1,509 111 1,620 1,315 23.2%
Other 485 38 523 760 (31.2)%
Total revenue 5,935 464 6,399 6,888 (7.1)%
Operating costs and expenses 5,797 479 6,276 6,770 (7.3)%
Operating income (loss) before
depreciation and amortization $ 138 $ (15) $ 123 $ 118 4.7%
(a) Actual amounts include the results of operations for the NBCUniversal acquired businesses for the period January 29, 2011 through
December 31, 2011.
(b) Pro forma amounts include the results of operations for the NBCUniversal acquired businesses for the period January 1, 2011 through
January 28, 2011 and for the year ended December 31, 2010. These amounts also include pro forma adjustments as if the NBCUniversal
transaction had occurred on January 1, 2010, including the effects of acquisition accounting and the elimination of operating costs and
expenses directly related to the transaction, but do not include adjustments for costs related to integration activities, cost savings or
synergies that have been or may be achieved by the combined businesses. Pro forma amounts are not necessarily indicative of what the
results would have been had we operated the businesses since January 1, 2010.
(c) Pro forma combined amounts represent our pro forma results of operations as if the NBCUniversal transaction had occurred on Jan-
uary 1, 2010 but are not necessarily indicative of what the results would have been had we operated the businesses since January 1,
2010.
Broadcast Television Segment — Revenue
Advertising
Advertising revenue is generated from the sale of advertising time on our broadcast networks, owned local
television stations and related digital media properties. Our advertising revenue is generally based on audi-
ence ratings, the value of our viewer demographics to advertisers, and the number of advertising units we
can place in our broadcast networks’ and owned television stations’ programming schedules. Advertising
revenue is affected by the strength of the national and local advertising markets, general economic conditions
and the success of our programming.
Our pro forma combined advertising revenue decreased in 2011 primarily due to $601 million of revenue
recognized in 2010 related to the 2010 Vancouver Olympics. Excluding the impact of the 2010 Vancouver
Olympics, pro forma combined advertising revenue increased $44 million in 2011 primarily due to an increase
in the price of advertising units sold, which exceeded the adverse effects of the decline in audience ratings in
our primetime schedule.
Content Licensing
Content licensing revenue is generated from the licensing of our owned programming in the United States
and internationally. Content licensing revenue depends on the length and terms of the initial network license
for our owned programming, consumer acceptance of our programming and our ability to subsequently
license that programming to other networks, both in the United States and internationally, and to individual
local U.S. television stations. In recent years, the production and distribution costs related to our owned
programming have exceeded the revenue generated from the initial network license by an increasing amount.
Comcast 2011 Annual Report on Form 10-K 56