Comcast 2011 Annual Report Download - page 53
Download and view the complete annual report
Please find page 53 of the 2011 Comcast annual report below. You can navigate through the pages in the report by either clicking on the pages listed below, or by using the keyword search tool below to find specific information within the annual report.-
 1
1 -
2
-
3
-
4
-
5
-
6
-
7
-
8
-
9
-
10
-
11
-
12
-
13
-
14
-
15
-
16
-
17
-
18
-
19
-
20
-
21
-
22
-
23
-
24
-
25
-
26
-
27
-
28
-
29
-
30
-
31
-
32
-
33
-
34
-
35
-
36
-
37
-
38
-
39
-
40
-
41
-
42
-
 43
43 -
 44
44 -
 45
45 -
 46
46 -
 47
47 -
 48
48 -
 49
49 -
 50
50 -
 51
51 -
 52
52 -
 53
53 -
 54
54 -
 55
55 -
 56
56 -
 57
57 -
 58
58 -
 59
59 -
 60
60 -
 61
61 -
 62
62 -
 63
63 -
64
-
65
-
66
-
67
-
68
-
69
-
70
-
71
-
72
-
73
-
74
-
75
-
76
-
77
-
78
-
79
-
80
-
81
-
82
-
83
-
84
-
85
-
86
-
87
-
88
-
89
-
90
-
91
-
92
-
93
-
94
-
95
-
96
-
97
-
98
-
99
-
100
-
101
-
102
-
103
-
104
-
105
-
106
-
107
-
108
-
109
-
110
-
111
-
112
-
113
-
114
-
115
-
116
-
117
-
118
-
119
-
120
-
121
-
122
-
123
-
124
-
125
-
126
-
127
-
128
-
129
-
130
-
131
-
132
-
133
-
134
-
135
-
136
-
137
-
138
-
139
-
140
-
141
-
142
-
143
-
144
-
145
-
146
-
147
-
148
 |
 |
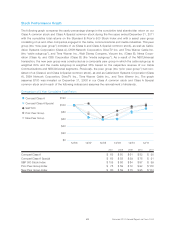
High-Speed Internet
As of December 31, 2011, 35% of the homes in the areas we serve subscribed to our high-speed Internet
services, compared to 33% and 31% as of December 31, 2010 and 2009, respectively. Our high-speed
Internet revenue increased in 2011 and 2010 primarily due to increases in the number of residential custom-
ers, rate adjustments and additional customers receiving higher levels of service.
Voice
As of December 31, 2011, 18% of the homes in the areas we serve subscribed to our voice services, com-
pared to 17% and 15% as of December 31, 2010 and 2009, respectively. Our voice revenue increased in
2011 and 2010 primarily due to increases in the number of residential customers.
Advertising
As part of our programming license agreements with cable networks, we generally receive an allocation of
scheduled advertising time that we may sell to local, regional and national advertisers. In most cases, the
available advertising time is sold by our sales force. In some cases, we work with representation firms as an
extension of our sales force to sell a portion of the advertising time allocated to us. We also coordinate the
advertising sales efforts of other multichannel video providers in some markets, and in some markets we
operate advertising interconnects. In addition, we generate revenue from the sale of advertising on
XFINITY.com and our On Demand service.
Advertising revenue is affected by the strength of the local advertising market and general economic con-
ditions. Our advertising revenue declined slightly in 2011 due to lower political advertising. Our advertising
revenue increased in 2010 primarily due to improvements in the overall television advertising market, includ-
ing political advertising.
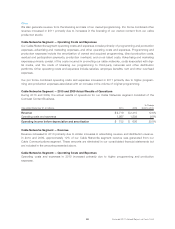
Business Services
Our business services revenue increased in 2011 and 2010 primarily due to increases in the number of cus-
tomers across all cable services.
Other
We receive revenue related to franchise and other regulatory fees, our digital media center, commissions from
electronic retailing networks, and fees from other services. Our franchise and regulatory fees represent the
fees required to be paid to federal, state and local authorities that we pass through to our customers. Under
the terms of our franchise agreements, we are generally required to pay to the franchising authority an
amount based on our gross video revenue. The changes in franchise and other regulatory fees collected from
our cable services customers are generally due to changes in the revenue on which the fees apply.
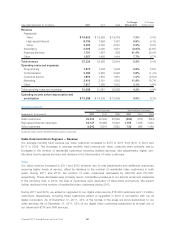
Cable Communications Segment — Operating Costs and Expenses
We continue to focus on controlling the growth of expenses. Our operating margin (operating income before
depreciation and amortization as a percentage of revenue) for 2011, 2010 and 2009 was 41.1%, 40.4% and
40.1%, respectively.
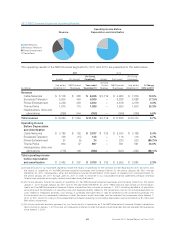
Programming Expenses
Programming expenses, our largest operating expense, are the fees we pay to license the programming we
distribute to our video customers. These expenses are affected by changes in the fees charged by cable
networks, the number of video customers we serve, the number of channels and programs we provide, and
the fees for retransmission of broadcast networks. Programming expenses increased in 2011 and 2010,
primarily due to increases in rates, additional digital video customers and additional programming options
offered. We anticipate that our programming expenses will continue to increase as the fees charged by pro-
gramming networks increase; as we provide additional channels and On Demand programming to our
51 Comcast 2011 Annual Report on Form 10-K