Comcast 2011 Annual Report Download - page 44
Download and view the complete annual report
Please find page 44 of the 2011 Comcast annual report below. You can navigate through the pages in the report by either clicking on the pages listed below, or by using the keyword search tool below to find specific information within the annual report.-
 1
1 -
2
-
3
-
4
-
5
-
6
-
7
-
8
-
9
-
10
-
11
-
12
-
13
-
14
-
15
-
16
-
17
-
18
-
19
-
20
-
21
-
22
-
23
-
24
-
25
-
26
-
27
-
28
-
29
-
30
-
31
-
32
-
33
-
 34
34 -
 35
35 -
 36
36 -
 37
37 -
 38
38 -
 39
39 -
 40
40 -
 41
41 -
 42
42 -
 43
43 -
 44
44 -
 45
45 -
 46
46 -
 47
47 -
 48
48 -
 49
49 -
 50
50 -
 51
51 -
 52
52 -
 53
53 -
 54
54 -
55
-
56
-
57
-
58
-
59
-
60
-
61
-
62
-
63
-
64
-
65
-
66
-
67
-
68
-
69
-
70
-
71
-
72
-
73
-
74
-
75
-
76
-
77
-
78
-
79
-
80
-
81
-
82
-
83
-
84
-
85
-
86
-
87
-
88
-
89
-
90
-
91
-
92
-
93
-
94
-
95
-
96
-
97
-
98
-
99
-
100
-
101
-
102
-
103
-
104
-
105
-
106
-
107
-
108
-
109
-
110
-
111
-
112
-
113
-
114
-
115
-
116
-
117
-
118
-
119
-
120
-
121
-
122
-
123
-
124
-
125
-
126
-
127
-
128
-
129
-
130
-
131
-
132
-
133
-
134
-
135
-
136
-
137
-
138
-
139
-
140
-
141
-
142
-
143
-
144
-
145
-
146
-
147
-
148
 |
 |

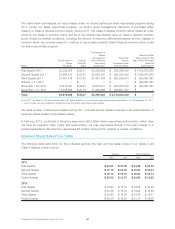
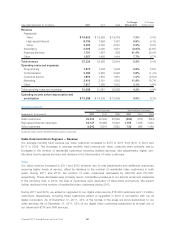
Item 6: Selected Financial Data
Year ended December 31 (in millions, except per share data) 2011(b) 2010 2009 2008 2007
Statement of Operations Data
Revenue $ 55,842 $ 37,937 $ 35,756 $ 34,423 $ 31,060
Operating income 10,721 7,980 7,214 6,732 5,578
Net income attributable to Comcast Corporation(a) 4,160 3,635 3,638 2,547 2,587
Basic earnings per common share attributable to
Comcast Corporation shareholders $ 1.51 $ 1.29 $ 1.27 $ 0.87 $ 0.84
Diluted earnings per common share attributable to
Comcast Corporation shareholders $ 1.50 $ 1.29 $ 1.26 $ 0.86 $ 0.83
Dividends declared per common share attributable to
Comcast Corporation shareholders $ 0.45 $ 0.378 $ 0.297 $ 0.25 $ —
Balance Sheet Data (at year end)
Total assets $ 157,818 $ 118,534 $ 112,733 $ 113,017 $ 113,417
Total debt, including current portion 39,309 31,415 29,096 32,456 31,323
Comcast Corporation shareholders’ equity 47,274 44,354 42,721 40,450 41,340
Statement of Cash Flows Data
Net cash provided by (used in):
Operating activities $ 14,345 $ 11,179 $ 10,281 $ 10,231 $ 8,189
Investing activities (12,508) (5,711) (5,897) (7,477) (8,149)
Financing activities (6,201) (155) (4,908) (2,522) (316)
(a) Net income attributable to Comcast Corporation in 2011 is stated after deducting net income of $1 billion attributable to noncontrolling
interests.
(b) On January 28, 2011, we completed the NBCUniversal transaction. Refer to Management’s Discussion and Analysis of Financial Con-
dition and Results of Operations included in this Annual Report for a discussion of the effects of the NBCUniversal transaction on the
comparability of the information presented in this financial data.
Comcast 2011 Annual Report on Form 10-K 42