Comcast 2011 Annual Report Download - page 56
Download and view the complete annual report
Please find page 56 of the 2011 Comcast annual report below. You can navigate through the pages in the report by either clicking on the pages listed below, or by using the keyword search tool below to find specific information within the annual report.-
 1
1 -
2
-
3
-
4
-
5
-
6
-
7
-
8
-
9
-
10
-
11
-
12
-
13
-
14
-
15
-
16
-
17
-
18
-
19
-
20
-
21
-
22
-
23
-
24
-
25
-
26
-
27
-
28
-
29
-
30
-
31
-
32
-
33
-
34
-
35
-
36
-
37
-
38
-
39
-
40
-
41
-
42
-
43
-
44
-
45
-
 46
46 -
 47
47 -
 48
48 -
 49
49 -
 50
50 -
 51
51 -
 52
52 -
 53
53 -
 54
54 -
 55
55 -
 56
56 -
 57
57 -
 58
58 -
 59
59 -
 60
60 -
 61
61 -
 62
62 -
 63
63 -
 64
64 -
 65
65 -
 66
66 -
67
-
68
-
69
-
70
-
71
-
72
-
73
-
74
-
75
-
76
-
77
-
78
-
79
-
80
-
81
-
82
-
83
-
84
-
85
-
86
-
87
-
88
-
89
-
90
-
91
-
92
-
93
-
94
-
95
-
96
-
97
-
98
-
99
-
100
-
101
-
102
-
103
-
104
-
105
-
106
-
107
-
108
-
109
-
110
-
111
-
112
-
113
-
114
-
115
-
116
-
117
-
118
-
119
-
120
-
121
-
122
-
123
-
124
-
125
-
126
-
127
-
128
-
129
-
130
-
131
-
132
-
133
-
134
-
135
-
136
-
137
-
138
-
139
-
140
-
141
-
142
-
143
-
144
-
145
-
146
-
147
-
148
 |
 |

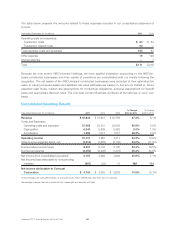
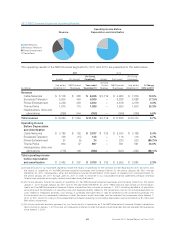
Cable Networks Segment — Results of Operations
Cable Networks Segment — 2011 and 2010 Actual and Pro Forma Results of Operations
2011 2010
Actual(a)
Pro
Forma(b)
Pro Forma
Combined(c) Actual(a) Pro Forma(b)
Pro Forma
Combined(c)
(in millions)
Year ended
December 31
For the
period
January 1
through
January 28
Year ended
December 31
Comcast
Content
Business
NBCUniversal
Businesses
Year ended
December 31
% Change
2010 to 2011
Revenue
Distribution $ 4,210 $ 188 $ 4,398 $ 1,599 $ 2,366 $ 3,965 10.9%
Advertising 3,189 162 3,351 914 2,170 3,084 8.7%
Other 709 38 747 206 424 630 18.7%
Total revenue 8,108 388 8,496 2,719 4,960 7,679 10.6%
Operating costs and expenses 4,923 236 5,159 1,987 2,526 4,513 14.3%
Operating income before
depreciation and amortization $ 3,185 $ 152 $ 3,337 $ 732 $ 2,434 $ 3,166 5.4%
(a) Actual amounts include the results of operations for the Comcast Content Business for 2011 and 2010 and the results of operations for
the NBCUniversal acquired businesses for the period January 29 through December 31, 2011.
(b) Pro forma amounts include the results of operations for the NBCUniversal acquired businesses for the period January 1, 2011 through
January 28, 2011 and for the year ended December 31, 2010. These amounts also include pro forma adjustments as if the NBCUniversal
transaction had occurred on January 1, 2010, including the effects of acquisition accounting and the elimination of operating costs and
expenses directly related to the transaction, but do not include adjustments for costs related to integration activities, cost savings or
synergies that have been or may be achieved by the combined businesses. Pro forma amounts are not necessarily indicative of what the
results would have been had we operated the businesses since January 1, 2010.
(c) Pro forma combined amounts represent our pro forma results of operations as if the NBCUniversal transaction had occurred on Jan-
uary 1, 2010 but are not necessarily indicative of what the results would have been had we operated the businesses since January 1,
2010.
Cable Networks Segment — Revenue
Distribution
Distribution revenue is generated from distribution agreements with multichannel video providers and is
affected by the number of subscribers receiving our cable networks and the fees we charge per subscriber.
Pro forma combined distribution revenue increased in 2011 primarily due to rate increases and increases in
the number of subscribers to our cable networks.
In 2011, 13% of our Cable Networks segment actual revenue was generated from our Cable Communications
segment. These amounts are eliminated in our consolidated financial statements but are included in the
amounts presented above.
Advertising
Advertising revenue is generated from the sale of advertising time on our cable networks and related digital
media properties. Our advertising revenue depends on audience ratings, the value of the demographics of
our cable networks’ viewers to advertisers and the number of advertising units we can place in our cable
networks’ programming schedules. Advertising revenue is affected by the strength of the advertising market,
general economic conditions and the success of our programming.
Pro forma combined advertising revenue increased in 2011 primarily due to increases in the price of advertis-
ing units sold.
Comcast 2011 Annual Report on Form 10-K 54