Comcast 2011 Annual Report Download - page 52
Download and view the complete annual report
Please find page 52 of the 2011 Comcast annual report below. You can navigate through the pages in the report by either clicking on the pages listed below, or by using the keyword search tool below to find specific information within the annual report.-
 1
1 -
2
-
3
-
4
-
5
-
6
-
7
-
8
-
9
-
10
-
11
-
12
-
13
-
14
-
15
-
16
-
17
-
18
-
19
-
20
-
21
-
22
-
23
-
24
-
25
-
26
-
27
-
28
-
29
-
30
-
31
-
32
-
33
-
34
-
35
-
36
-
37
-
38
-
39
-
40
-
41
-
 42
42 -
 43
43 -
 44
44 -
 45
45 -
 46
46 -
 47
47 -
 48
48 -
 49
49 -
 50
50 -
 51
51 -
 52
52 -
 53
53 -
 54
54 -
 55
55 -
 56
56 -
 57
57 -
 58
58 -
 59
59 -
 60
60 -
 61
61 -
 62
62 -
63
-
64
-
65
-
66
-
67
-
68
-
69
-
70
-
71
-
72
-
73
-
74
-
75
-
76
-
77
-
78
-
79
-
80
-
81
-
82
-
83
-
84
-
85
-
86
-
87
-
88
-
89
-
90
-
91
-
92
-
93
-
94
-
95
-
96
-
97
-
98
-
99
-
100
-
101
-
102
-
103
-
104
-
105
-
106
-
107
-
108
-
109
-
110
-
111
-
112
-
113
-
114
-
115
-
116
-
117
-
118
-
119
-
120
-
121
-
122
-
123
-
124
-
125
-
126
-
127
-
128
-
129
-
130
-
131
-
132
-
133
-
134
-
135
-
136
-
137
-
138
-
139
-
140
-
141
-
142
-
143
-
144
-
145
-
146
-
147
-
148
 |
 |

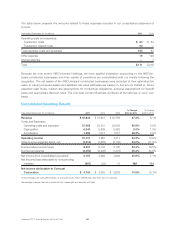
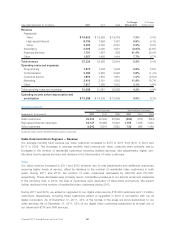
Year ended December 31 (in millions) 2011 2010 2009
% Change
2010 to 2011
% Change
2009 to 2010
Revenue
Residential:
Video $ 19,625 $ 19,363 $ 19,279 1.3% 0.4%
High-speed Internet 8,735 7,958 7,281 9.8% 9.3%
Voice 3,503 3,300 3,091 6.2% 6.8%
Advertising 2,005 2,020 1,621 (0.8)% 24.6%
Business services 1,791 1,267 828 41.4% 53.0%
Other 1,567 1,455 1,444 7.7% 0.7%
Total revenue 37,226 35,363 33,544 5.3% 5.4%
Operating costs and expenses
Programming 7,870 7,438 7,046 5.8% 5.6%
Technical labor 2,280 2,263 2,295 0.8% (1.4)%
Customer service 1,855 1,833 1,881 1.2% (2.5)%
Marketing 2,416 2,161 1,820 11.8% 18.7%
Other 7,517 7,366 7,043 2.1% 4.6%
Total operating costs and expenses 21,938 21,061 20,085 4.2% 4.9%
Operating income before depreciation and
amortization $ 15,288 $ 14,302 $ 13,459 6.9% 6.3%
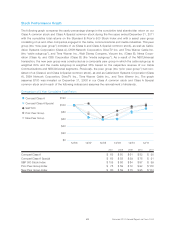
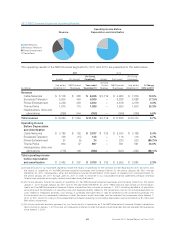
Customer Metrics
Total Customers Net Additional Customers
December 31 (in thousands) 2011 2010 2009 2011 2010 2009
Video customers 22,343 22,802 23,559 (460) (757) (623)
High-speed Internet customers 18,147 16,988 15,930 1,159 1,058 1,002
Voice customers 9,342 8,610 7,622 732 988 1,149
Customer data include residential and business customers.
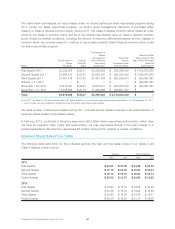
Cable Communications Segment — Revenue
Our average monthly total revenue per video customer increased to $137 in 2011 from $127 in 2010 and
$117 in 2009. The increases in average monthly total revenue per video customer were primarily due to
increases in the number of residential customers receiving multiple services, rate adjustments, higher con-
tributions from business services and declines in the total number of video customers.
Video
Our video revenue increased in 2011 and 2010 primarily due to rate adjustments and additional customers
receiving higher levels of service, offset by declines in the number of residential video customers in both
years. During 2011 and 2010, the number of video customers decreased by 460,000 and 757,000,
respectively. These decreases were primarily due to competitive pressures in our service areas and weakness
in the economy and, in 2010, the loss of customers upon expiration of discounted promotions. We expect
further declines in the number of residential video customers during 2012.
During 2011 and 2010, we added or upgraded to our digital video service 816,000 customers and 1.3 million
customers, respectively, including those customers added or upgraded in 2010 in connection with our all
digital conversion. As of December 31, 2011, 43% of the homes in the areas we serve subscribed to our
video services. As of December 31, 2011, 53% of our digital video customers subscribed to at least one of
our advanced HDTV and DVR services.
Comcast 2011 Annual Report on Form 10-K 50