Comcast 2011 Annual Report Download - page 135
Download and view the complete annual report
Please find page 135 of the 2011 Comcast annual report below. You can navigate through the pages in the report by either clicking on the pages listed below, or by using the keyword search tool below to find specific information within the annual report.-
 1
1 -
2
-
3
-
4
-
5
-
6
-
7
-
8
-
9
-
10
-
11
-
12
-
13
-
14
-
15
-
16
-
17
-
18
-
19
-
20
-
21
-
22
-
23
-
24
-
25
-
26
-
27
-
28
-
29
-
30
-
31
-
32
-
33
-
34
-
35
-
36
-
37
-
38
-
39
-
40
-
41
-
42
-
43
-
44
-
45
-
46
-
47
-
48
-
49
-
50
-
51
-
52
-
53
-
54
-
55
-
56
-
57
-
58
-
59
-
60
-
61
-
62
-
63
-
64
-
65
-
66
-
67
-
68
-
69
-
70
-
71
-
72
-
73
-
74
-
75
-
76
-
77
-
78
-
79
-
80
-
81
-
82
-
83
-
84
-
85
-
86
-
87
-
88
-
89
-
90
-
91
-
92
-
93
-
94
-
95
-
96
-
97
-
98
-
99
-
100
-
101
-
102
-
103
-
104
-
105
-
106
-
107
-
108
-
109
-
110
-
111
-
112
-
113
-
114
-
115
-
116
-
117
-
118
-
119
-
120
-
121
-
122
-
123
-
124
-
 125
125 -
 126
126 -
 127
127 -
 128
128 -
 129
129 -
 130
130 -
 131
131 -
 132
132 -
 133
133 -
 134
134 -
 135
135 -
 136
136 -
 137
137 -
 138
138 -
 139
139 -
 140
140 -
 141
141 -
 142
142 -
 143
143 -
 144
144 -
 145
145 -
146
-
147
-
148
 |
 |

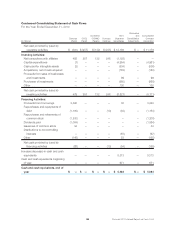
Condensed Consolidating Statement of Cash Flows
For the Year Ended December 31, 2010
(in millions)
Comcast
Parent
CCCL
Parent
Combined
CCHMO
Parents
Comcast
Holdings
Non-
Guarantor
Subsidiaries
Elimination
and
Consolidation
Adjustments
Consolidated
Comcast
Corporation
Net cash provided by (used in)
operating activities $ (391) $ (257) $ (132) $ (235) $ 12,194 $ — $ 11,179
Investing Activities:
Net transactions with affiliates 488 257 132 248 (1,125) — —
Capital expenditures (7) — — — (4,954) — (4,961)
Cash paid for intangible assets (2) — — — (534) — (536)
Acquisitions, net of cash acquired — — — — (183) — (183)
Proceeds from sales of businesses
and investments — — — — 99 — 99
Purchases of investments — — — — (260) — (260)
Other — — — — 130 — 130
Net cash provided by (used in)
investing activities 479 257 132 248 (6,827) — (5,711)
Financing Activities:
Proceeds from borrowings 3,390 — — — 30 — 3,420
Repurchases and repayments of
debt (1,100) — — (13) (40) — (1,153)
Repurchases and retirements of
common stock (1,200) — — — — — (1,200)
Dividends paid (1,064) — — — — — (1,064)
Issuances of common stock 34 — — — — — 34
Distributions to noncontrolling
interests — — — — (67) — (67)
Other (148) — — — 23 — (125)
Net cash provided by (used in)
financing activities (88) — — (13) (54) — (155)
Increase (decrease) in cash and cash
equivalents — — — — 5,313 — 5,313
Cash and cash equivalents, beginning
of year — — — — 671 — 671
Cash and cash equivalents, end of
year $ — $ — $ — $ — $ 5,984 $ — $ 5,984
133 Comcast 2011 Annual Report on Form 10-K