Comcast 2011 Annual Report Download - page 82
Download and view the complete annual report
Please find page 82 of the 2011 Comcast annual report below. You can navigate through the pages in the report by either clicking on the pages listed below, or by using the keyword search tool below to find specific information within the annual report.-
 1
1 -
2
-
3
-
4
-
5
-
6
-
7
-
8
-
9
-
10
-
11
-
12
-
13
-
14
-
15
-
16
-
17
-
18
-
19
-
20
-
21
-
22
-
23
-
24
-
25
-
26
-
27
-
28
-
29
-
30
-
31
-
32
-
33
-
34
-
35
-
36
-
37
-
38
-
39
-
40
-
41
-
42
-
43
-
44
-
45
-
46
-
47
-
48
-
49
-
50
-
51
-
52
-
53
-
54
-
55
-
56
-
57
-
58
-
59
-
60
-
61
-
62
-
63
-
64
-
65
-
66
-
67
-
68
-
69
-
70
-
71
-
 72
72 -
 73
73 -
 74
74 -
 75
75 -
 76
76 -
 77
77 -
 78
78 -
 79
79 -
 80
80 -
 81
81 -
 82
82 -
 83
83 -
 84
84 -
 85
85 -
 86
86 -
 87
87 -
 88
88 -
 89
89 -
 90
90 -
 91
91 -
 92
92 -
93
-
94
-
95
-
96
-
97
-
98
-
99
-
100
-
101
-
102
-
103
-
104
-
105
-
106
-
107
-
108
-
109
-
110
-
111
-
112
-
113
-
114
-
115
-
116
-
117
-
118
-
119
-
120
-
121
-
122
-
123
-
124
-
125
-
126
-
127
-
128
-
129
-
130
-
131
-
132
-
133
-
134
-
135
-
136
-
137
-
138
-
139
-
140
-
141
-
142
-
143
-
144
-
145
-
146
-
147
-
148
 |
 |

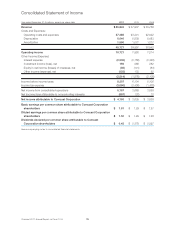
Consolidated Statement of Cash Flows
Year ended December 31 (in millions) 2011 2010 2009
Operating Activities
Net income from consolidated operations $ 5,157 $ 3,668 $ 3,628
Adjustments to reconcile net income from consolidated operations to net cash
provided by operating activities:
Depreciation and amortization 7,636 6,616 6,500
Amortization of film and television costs 6,787 187 349
Share-based compensation 344 300 257
Noncash interest expense (income), net 146 141 160
Equity in net (income) losses of investees, net 35 141 64
Cash received from investees 311 ——
Net (gain) loss on investment activity and other 23 (267) (201)
Deferred income taxes 1,058 549 832
Changes in operating assets and liabilities, net of effects of acquisitions and
divestitures:
Change in receivable, net (18) (131) (84)
Change in film and television costs (7,080) (191) (404)
Change in accounts payable and accrued expenses related to trade creditors (45) 37 (136)
Change in other operating assets and liabilities (9) 129 (684)
Net cash provided by (used in) operating activities 14,345 11,179 10,281
Investing Activities
Capital expenditures (5,307) (4,961) (5,117)
Cash paid for intangible assets (954) (536) (522)
Acquisitions, net of cash acquired (6,407) (183) (88)
Proceeds from sales of businesses and investments 277 99 102
Purchases of investments (135) (260) (346)
Other 18 130 74
Net cash provided by (used in) investing activities (12,508) (5,711) (5,897)
Financing Activities
Proceeds from (repayments of) short-term borrowings, net 544 ——
Proceeds from borrowings —3,420 1,564
Repurchases and repayments of debt (3,216) (1,153) (4,738)
Repurchases and retirements of common stock (2,141) (1,200) (765)
Dividends paid (1,187) (1,064) (761)
Issuances of common stock 283 34 1
Distributions to noncontrolling interests (325) (67) (49)
Other (159) (125) (160)
Net cash provided by (used in) financing activities (6,201) (155) (4,908)
Increase (decrease) in cash and cash equivalents (4,364) 5,313 (524)
Cash and cash equivalents, beginning of year 5,984 671 1,195
Cash and cash equivalents, end of year $ 1,620 $ 5,984 $ 671
See accompanying notes to consolidated financial statements.
Comcast 2011 Annual Report on Form 10-K 80