Comcast 2011 Annual Report Download - page 48
Download and view the complete annual report
Please find page 48 of the 2011 Comcast annual report below. You can navigate through the pages in the report by either clicking on the pages listed below, or by using the keyword search tool below to find specific information within the annual report.-
 1
1 -
2
-
3
-
4
-
5
-
6
-
7
-
8
-
9
-
10
-
11
-
12
-
13
-
14
-
15
-
16
-
17
-
18
-
19
-
20
-
21
-
22
-
23
-
24
-
25
-
26
-
27
-
28
-
29
-
30
-
31
-
32
-
33
-
34
-
35
-
36
-
37
-
 38
38 -
 39
39 -
 40
40 -
 41
41 -
 42
42 -
 43
43 -
 44
44 -
 45
45 -
 46
46 -
 47
47 -
 48
48 -
 49
49 -
 50
50 -
 51
51 -
 52
52 -
 53
53 -
 54
54 -
 55
55 -
 56
56 -
 57
57 -
 58
58 -
59
-
60
-
61
-
62
-
63
-
64
-
65
-
66
-
67
-
68
-
69
-
70
-
71
-
72
-
73
-
74
-
75
-
76
-
77
-
78
-
79
-
80
-
81
-
82
-
83
-
84
-
85
-
86
-
87
-
88
-
89
-
90
-
91
-
92
-
93
-
94
-
95
-
96
-
97
-
98
-
99
-
100
-
101
-
102
-
103
-
104
-
105
-
106
-
107
-
108
-
109
-
110
-
111
-
112
-
113
-
114
-
115
-
116
-
117
-
118
-
119
-
120
-
121
-
122
-
123
-
124
-
125
-
126
-
127
-
128
-
129
-
130
-
131
-
132
-
133
-
134
-
135
-
136
-
137
-
138
-
139
-
140
-
141
-
142
-
143
-
144
-
145
-
146
-
147
-
148
 |
 |

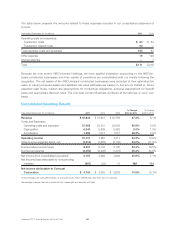
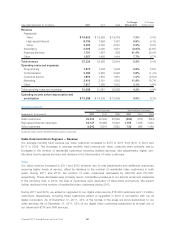
The table below presents the amounts related to these expenses included in our consolidated statement of
income.
Year ended December 31 (in millions) 2011 2010
Operating costs and expenses:
Transaction costs $63 $80
Transaction-related costs 92 —
Total operating costs and expenses 155 80
Other expense 16 129
Interest expense —7
Total $ 171 $ 216
Because we now control NBCUniversal Holdings, we have applied acquisition accounting to the NBCUni-
versal contributed businesses and their results of operations are consolidated with our results following the
acquisition. The net assets of the NBCUniversal contributed businesses were recorded at their estimated fair
value. In valuing acquired assets and liabilities, fair value estimates are based on, but are not limited to, future
expected cash flows, market rate assumptions for contractual obligations, actuarial assumptions for benefit
plans and appropriate discount rates. The Comcast Content Business continues at its historical or carry-over
basis.
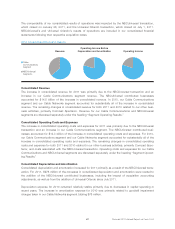
Consolidated Operating Results
Year ended December 31 (in millions) 2011 2010 2009
% Change
2010 to 2011
% Change
2009 to 2010
Revenue $ 55,842 $ 37,937 $ 35,756 47.2% 6.1%
Costs and Expenses:
Operating costs and expenses 37,485 23,341 22,042 60.6% 5.9%
Depreciation 6,040 5,539 5,483 9.0% 1.0%
Amortization 1,596 1,077 1,017 48.3% 5.9%
Operating income 10,721 7,980 7,214 34.3% 10.6%
Other income (expense) items, net (2,514) (1,876) (2,108) 34.0% (11.0)%
Income before income taxes 8,207 6,104 5,106 34.4% 19.5%
Income tax expense (3,050) (2,436) (1,478) 25.2% 64.8%
Net income from consolidated operations 5,157 3,668 3,628 40.6% 1.1%
Net (income) loss attributable to noncontrolling
interests (997) (33) 10 NM NM
Net income attributable to Comcast
Corporation $ 4,160 $ 3,635 $ 3,638 14.5% (0.1)%
All percentages are calculated based on actual amounts. Minor differences may exist due to rounding.
Percentage changes that are considered not meaningful are denoted with NM.
Comcast 2011 Annual Report on Form 10-K 46