Comcast 2011 Annual Report Download - page 101
Download and view the complete annual report
Please find page 101 of the 2011 Comcast annual report below. You can navigate through the pages in the report by either clicking on the pages listed below, or by using the keyword search tool below to find specific information within the annual report.-
 1
1 -
2
-
3
-
4
-
5
-
6
-
7
-
8
-
9
-
10
-
11
-
12
-
13
-
14
-
15
-
16
-
17
-
18
-
19
-
20
-
21
-
22
-
23
-
24
-
25
-
26
-
27
-
28
-
29
-
30
-
31
-
32
-
33
-
34
-
35
-
36
-
37
-
38
-
39
-
40
-
41
-
42
-
43
-
44
-
45
-
46
-
47
-
48
-
49
-
50
-
51
-
52
-
53
-
54
-
55
-
56
-
57
-
58
-
59
-
60
-
61
-
62
-
63
-
64
-
65
-
66
-
67
-
68
-
69
-
70
-
71
-
72
-
73
-
74
-
75
-
76
-
77
-
78
-
79
-
80
-
81
-
82
-
83
-
84
-
85
-
86
-
87
-
88
-
89
-
90
-
 91
91 -
 92
92 -
 93
93 -
 94
94 -
 95
95 -
 96
96 -
 97
97 -
 98
98 -
 99
99 -
 100
100 -
 101
101 -
 102
102 -
 103
103 -
 104
104 -
 105
105 -
 106
106 -
 107
107 -
 108
108 -
 109
109 -
 110
110 -
 111
111 -
112
-
113
-
114
-
115
-
116
-
117
-
118
-
119
-
120
-
121
-
122
-
123
-
124
-
125
-
126
-
127
-
128
-
129
-
130
-
131
-
132
-
133
-
134
-
135
-
136
-
137
-
138
-
139
-
140
-
141
-
142
-
143
-
144
-
145
-
146
-
147
-
148
 |
 |

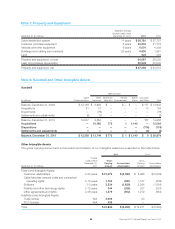
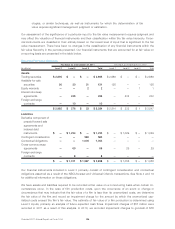
Note 7: Property and Equipment
December 31 (in millions)
Weighted Average
Original Useful Life at
December 31, 2011 2011 2010
Cable distribution system 11 years $ 28,781 $ 27,727
Customer premises equipment 6 years 23,552 21,716
Vehicles and other equipment 6 years 6,001 4,392
Buildings and building improvements 20 years 4,830 1,981
Land — 923 204
Property and equipment, at cost 64,087 56,020
Less: Accumulated depreciation 36,528 32,505
Property and equipment, net $ 27,559 $ 23,515
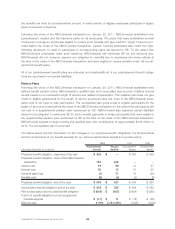
Note 8: Goodwill and Other Intangible Assets
Goodwill
(in millions)
Cable
Communications
NBCUniversal
Corporate
and Other Total
Cable
Networks
Broadcast
Television
Filmed
Entertainment
Theme
Parks
Balance, December 31, 2009 $ 12,128 $ 2,628 $ — $ — $ — $ 177 $ 14,933
Acquisitions 81 13 — — — 10 104
Impairments — (76) — — — — (76)
Settlements and adjustments (2) (1) — — — — (3)
Balance, December 31, 2010 12,207 2,564 — — — 187 14,958
Acquisitions — 10,180 772 1 1,140 — 12,093
Dispositions — — — — — (174) (174)
Settlements and adjustments 1 — — — — (4) (3)
Balance, December 31, 2011 $ 12,208 $ 12,744 $ 772 $ 1 $ 1,140 $ 9 $ 26,874
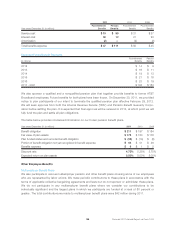
Other Intangible Assets
The gross carrying amount and accumulated amortization of our intangible assets are presented in the table below.
2011 2010
December 31 (in millions)
Original
Useful Life at
December 31,
2011
Gross
Carrying
Amount
Accumulated
Amortization
Gross
Carrying
Amount
Accumulated
Amortization
Finite-Lived Intangible Assets:
Customer relationships 4-20 years $ 15,079 $ (3,387) $ 6,968 $ (5,548)
Cable franchise renewal costs and contractual
operating rights 5-15 years 1,152 (581) 1,077 (608)
Software 3-5 years 3,234 (1,839) 2,594 (1,624)
Patents and other technology rights 3-12 years 344 (256) 307 (207)
Other agreements and rights 3-36 years 1,379 (602) 1,272 (853)
Indefinite-Lived Intangible Assets:
Trade names N/A 3,006 53
FCC licenses N/A 636 —
Total $ 24,830 $ (6,665) $ 12,271 $ (8,840)
99 Comcast 2011 Annual Report on Form 10-K