Comcast 2011 Annual Report Download - page 12
Download and view the complete annual report
Please find page 12 of the 2011 Comcast annual report below. You can navigate through the pages in the report by either clicking on the pages listed below, or by using the keyword search tool below to find specific information within the annual report.-
 1
1 -
 2
2 -
 3
3 -
 4
4 -
 5
5 -
 6
6 -
 7
7 -
 8
8 -
 9
9 -
 10
10 -
 11
11 -
 12
12 -
 13
13 -
 14
14 -
 15
15 -
 16
16 -
 17
17 -
 18
18 -
 19
19 -
 20
20 -
 21
21 -
 22
22 -
23
-
24
-
25
-
26
-
27
-
28
-
29
-
30
-
31
-
32
-
33
-
34
-
35
-
36
-
37
-
38
-
39
-
40
-
41
-
42
-
43
-
44
-
45
-
46
-
47
-
48
-
49
-
50
-
51
-
52
-
53
-
54
-
55
-
56
-
57
-
58
-
59
-
60
-
61
-
62
-
63
-
64
-
65
-
66
-
67
-
68
-
69
-
70
-
71
-
72
-
73
-
74
-
75
-
76
-
77
-
78
-
79
-
80
-
81
-
82
-
83
-
84
-
85
-
86
-
87
-
88
-
89
-
90
-
91
-
92
-
93
-
94
-
95
-
96
-
97
-
98
-
99
-
100
-
101
-
102
-
103
-
104
-
105
-
106
-
107
-
108
-
109
-
110
-
111
-
112
-
113
-
114
-
115
-
116
-
117
-
118
-
119
-
120
-
121
-
122
-
123
-
124
-
125
-
126
-
127
-
128
-
129
-
130
-
131
-
132
-
133
-
134
-
135
-
136
-
137
-
138
-
139
-
140
-
141
-
142
-
143
-
144
-
145
-
146
-
147
-
148
 |
 |

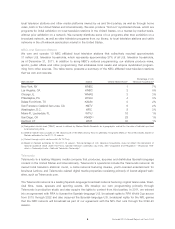
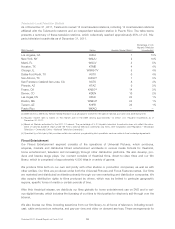
Telemundo Local Television Stations
As of December 31, 2011, Telemundo owned 15 local television stations, including 14 local television stations
affiliated with the Telemundo network and an independent television station in Puerto Rico. The table below
presents a summary of these television stations, which collectively reached approximately 55% of U.S. His-
panic television households as of December 31, 2011.
DMA Served(a) Station Hispanic Market Rank(b)
Percentage of U.S.
Hispanic Television
Households(c)
Los Angeles, CA KVEA 1 13%
New York, NY WNJU 2 10%
Miami, FL WSCV 3 5%
Houston, TX KTMD 4 4%
Chicago, IL WSNS-TV 5 4%
Dallas-Fort Worth, TX KXTX 6 4%
San Antonio, TX KVDA(d) 73%
San Francisco-Oakland-San Jose, CA KSTS 8 3%
Phoenix, AZ KTAZ 9 2%
Fresno, CA KNSO(d) 14 2%
Denver, CO KDEN 16 2%
Las Vegas, NV KBLR 23 1%
Boston, MA WNEU(d) 24 1%
Tucson, AZ KHRR 25 1%
Puerto Rico WKAQ — —
(a) DMA served is defined by Nielsen Media Research as a geographic market for the sale of national spot and local advertising time.
(b) Hispanic market rank is based on the relative size of the DMA among approximately 14 million U.S. Hispanic households as of
December 31, 2011.
(c) Based on Nielsen estimates for the 2011-12 season. The percentage of U.S. Hispanic television households does not reflect the calcu-
lation of national audience reach under the FCC’s national television ownership cap limits. See “Legislation and Regulation – Broadcast
Television – Ownership Limits – National Television Ownership.”
(d) Operated by a third party that provides certain non-network programming and operations services under a time brokerage agreement.
Filmed Entertainment
Our Filmed Entertainment segment consists of the operations of Universal Pictures, which produces,
acquires, markets and distributes filmed entertainment worldwide in various media formats for theatrical,
home entertainment, television and increasingly through other distribution platforms. We also develop, pro-
duce and license stage plays. Our content consists of theatrical films, direct-to-video titles and our film
library, which is comprised of approximately 4,500 titles in a variety of genres.
We produce films both on our own and jointly with other studios or production companies, as well as with
other entities. Our films are produced under both the Universal Pictures and Focus Features names. Our films
are marketed and distributed worldwide primarily through our own marketing and distribution companies. We
also acquire distribution rights to films produced by others, which may be limited to particular geographic
regions, specific forms of media or certain periods of time.
After their theatrical release, we distribute our films globally for home entertainment use on DVD and in vari-
ous digital formats, which includes the licensing of our films to third parties for electronic sell-through over the
Internet.
We also license our films, including selections from our film library, to all forms of television, including broad-
cast, cable and premium networks, and pay-per-view and video on demand services. These arrangements for
Comcast 2011 Annual Report on Form 10-K 10