Comcast 2011 Annual Report Download - page 132
Download and view the complete annual report
Please find page 132 of the 2011 Comcast annual report below. You can navigate through the pages in the report by either clicking on the pages listed below, or by using the keyword search tool below to find specific information within the annual report.-
 1
1 -
2
-
3
-
4
-
5
-
6
-
7
-
8
-
9
-
10
-
11
-
12
-
13
-
14
-
15
-
16
-
17
-
18
-
19
-
20
-
21
-
22
-
23
-
24
-
25
-
26
-
27
-
28
-
29
-
30
-
31
-
32
-
33
-
34
-
35
-
36
-
37
-
38
-
39
-
40
-
41
-
42
-
43
-
44
-
45
-
46
-
47
-
48
-
49
-
50
-
51
-
52
-
53
-
54
-
55
-
56
-
57
-
58
-
59
-
60
-
61
-
62
-
63
-
64
-
65
-
66
-
67
-
68
-
69
-
70
-
71
-
72
-
73
-
74
-
75
-
76
-
77
-
78
-
79
-
80
-
81
-
82
-
83
-
84
-
85
-
86
-
87
-
88
-
89
-
90
-
91
-
92
-
93
-
94
-
95
-
96
-
97
-
98
-
99
-
100
-
101
-
102
-
103
-
104
-
105
-
106
-
107
-
108
-
109
-
110
-
111
-
112
-
113
-
114
-
115
-
116
-
117
-
118
-
119
-
120
-
121
-
 122
122 -
 123
123 -
 124
124 -
 125
125 -
 126
126 -
 127
127 -
 128
128 -
 129
129 -
 130
130 -
 131
131 -
 132
132 -
 133
133 -
 134
134 -
 135
135 -
 136
136 -
 137
137 -
 138
138 -
 139
139 -
 140
140 -
 141
141 -
 142
142 -
143
-
144
-
145
-
146
-
147
-
148
 |
 |

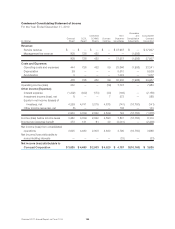
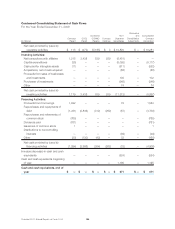
Condensed Consolidating Statement of Income
For the Year Ended December 31, 2010
(in millions)
Comcast
Parent
CCCL
Parent
Combined
CCHMO
Parents
Comcast
Holdings
Non-
Guarantor
Subsidiaries
Elimination
and
Consolidation
Adjustments
Consolidated
Comcast
Corporation
Revenue:
Service revenue $ — $ — $ — $ — $ 37,937 $ — $ 37,937
Management fee revenue 808 726 452 — — (1,986) —
808 726 452 — 37,937 (1,986) 37,937
Costs and Expenses:
Operating costs and expenses 444 726 452 59 23,646 (1,986) 23,341
Depreciation 29 — — — 5,510 — 5,539
Amortization 3 — — — 1,074 — 1,077
476 726 452 59 30,230 (1,986) 29,957
Operating income (loss) 332 — — (59) 7,707 — 7,980
Other Income (Expense):
Interest expense (1,402) (402) (173) (33) (146) — (2,156)
Investment income (loss), net 8 — — 7 273 — 288
Equity in net income (losses) of
investees, net 4,329 4,741 3,015 4,675 (141) (16,760) (141)
Other income (expense), net (5) — — — 138 — 133
2,930 4,339 2,842 4,649 124 (16,760) (1,876)
Income (loss) before income taxes 3,262 4,339 2,842 4,590 7,831 (16,760) 6,104
Income tax (expense) benefit 373 141 61 30 (3,041) — (2,436)
Net income (loss) from consolidated
operations 3,635 4,480 2,903 4,620 4,790 (16,760) 3,668
Net (income) loss attributable to
noncontrolling interests — — — — (33) — (33)
Net income (loss) attributable to
Comcast Corporation $ 3,635 $ 4,480 $ 2,903 $ 4,620 $ 4,757 $ (16,760) $ 3,635
Comcast 2011 Annual Report on Form 10-K 130