Comcast 2011 Annual Report Download - page 43
Download and view the complete annual report
Please find page 43 of the 2011 Comcast annual report below. You can navigate through the pages in the report by either clicking on the pages listed below, or by using the keyword search tool below to find specific information within the annual report.-
 1
1 -
2
-
3
-
4
-
5
-
6
-
7
-
8
-
9
-
10
-
11
-
12
-
13
-
14
-
15
-
16
-
17
-
18
-
19
-
20
-
21
-
22
-
23
-
24
-
25
-
26
-
27
-
28
-
29
-
30
-
31
-
32
-
 33
33 -
 34
34 -
 35
35 -
 36
36 -
 37
37 -
 38
38 -
 39
39 -
 40
40 -
 41
41 -
 42
42 -
 43
43 -
 44
44 -
 45
45 -
 46
46 -
 47
47 -
 48
48 -
 49
49 -
 50
50 -
 51
51 -
 52
52 -
 53
53 -
54
-
55
-
56
-
57
-
58
-
59
-
60
-
61
-
62
-
63
-
64
-
65
-
66
-
67
-
68
-
69
-
70
-
71
-
72
-
73
-
74
-
75
-
76
-
77
-
78
-
79
-
80
-
81
-
82
-
83
-
84
-
85
-
86
-
87
-
88
-
89
-
90
-
91
-
92
-
93
-
94
-
95
-
96
-
97
-
98
-
99
-
100
-
101
-
102
-
103
-
104
-
105
-
106
-
107
-
108
-
109
-
110
-
111
-
112
-
113
-
114
-
115
-
116
-
117
-
118
-
119
-
120
-
121
-
122
-
123
-
124
-
125
-
126
-
127
-
128
-
129
-
130
-
131
-
132
-
133
-
134
-
135
-
136
-
137
-
138
-
139
-
140
-
141
-
142
-
143
-
144
-
145
-
146
-
147
-
148
 |
 |

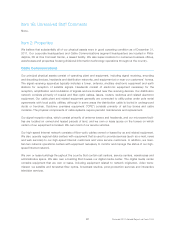
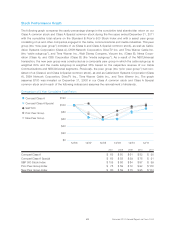
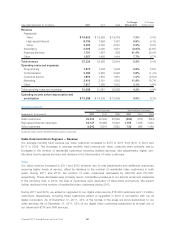
Stock Performance Graph
The following graph compares the yearly percentage change in the cumulative total shareholder return on our
Class A common stock and Class A Special common stock during the five years ended December 31, 2011
with the cumulative total returns on the Standard & Poor’s 500 Stock Index and with a select peer group
consisting of us and other companies engaged in the cable, communications and media industries. This peer
group (the “new peer group”) consists of us (Class A and Class A Special common stock), as well as Cable-
vision Systems Corporation (Class A), DISH Network Corporation, DirecTV Inc. and Time Warner Cable Inc.
(the “cable subgroup”), and Time Warner Inc., Walt Disney Company, Viacom Inc. (Class B), News Corpo-
ration (Class A), and CBS Corporation (Class B) (the “media subgroup”). As a result of the NBCUniversal
transaction, the new peer group was constructed as a composite peer group in which the cable subgroup is
weighted 64% and the media subgroup is weighted 36% based on the respective revenue of our Cable
Communications and NBCUniversal segments. Previously, the peer group (the “prior peer group”) had con-
sisted of us (Class A and Class A Special common stock), as well as Cablevision Systems Corporation (Class
A), DISH Network Corporation, DirecTV Inc., Time Warner Cable Inc., and Time Warner Inc. The graph
assumes $100 was invested on December 31, 2006 in our Class A common stock and Class A Special
common stock and in each of the following indices and assumes the reinvestment of dividends.
Comparison of 5 Year Cumulative Total Return
12/08
$0
$80
$60
$40
$20
$100
$120
12/1112/1012/0912/0712/06
•Comcast Class A
•Comcast Class A Special
•S&P 500
•
•
Prior Peer Group
New Peer Group
2007 2008 2009 2010 2011
Comcast Class A $ 65 $ 60 $ 61 $ 82 $ 90
Comcast Class A Special $ 65 $ 58 $ 59 $ 78 $ 91
S&P 500 Stock Index $ 105 $ 66 $ 84 $ 97 $ 99
Prior Peer Group Index $ 75 $ 59 $ 72 $ 92 $ 100
New Peer Group Index $ 80 $ 59 $ 75 $ 95 $ 104
41 Comcast 2011 Annual Report on Form 10-K