Berkshire Hathaway 2012 Annual Report Download - page 96
Download and view the complete annual report
Please find page 96 of the 2012 Berkshire Hathaway annual report below. You can navigate through the pages in the report by either clicking on the pages listed below, or by using the keyword search tool below to find specific information within the annual report.-
 1
1 -
2
-
3
-
4
-
5
-
6
-
7
-
8
-
9
-
10
-
11
-
12
-
13
-
14
-
15
-
16
-
17
-
18
-
19
-
20
-
21
-
22
-
23
-
24
-
25
-
26
-
27
-
28
-
29
-
30
-
31
-
32
-
33
-
34
-
35
-
36
-
37
-
38
-
39
-
40
-
41
-
42
-
43
-
44
-
45
-
46
-
47
-
48
-
49
-
50
-
51
-
52
-
53
-
54
-
55
-
56
-
57
-
58
-
59
-
60
-
61
-
62
-
63
-
64
-
65
-
66
-
67
-
68
-
69
-
70
-
71
-
72
-
73
-
74
-
75
-
76
-
77
-
78
-
79
-
80
-
81
-
82
-
83
-
84
-
85
-
 86
86 -
 87
87 -
 88
88 -
 89
89 -
 90
90 -
 91
91 -
 92
92 -
 93
93 -
 94
94 -
 95
95 -
 96
96 -
 97
97 -
 98
98 -
 99
99 -
 100
100 -
 101
101 -
 102
102 -
 103
103 -
 104
104 -
 105
105 -
 106
106 -
107
-
108
-
109
-
110
-
111
-
112
 |
 |

Management’s Discussion (Continued)
Interest Rate Risk
We regularly invest in bonds, loans or other interest rate sensitive instruments. Our strategy is to acquire such securities
that are attractively priced in relation to the perceived credit risk. Management recognizes and accepts that losses may occur
with respect to assets. We also strive to maintain high credit ratings so that the cost of our debt is minimized. We rarely utilize
derivative products, such as interest rate swaps, to manage interest rate risks.
The fair values of our fixed maturity investments and notes payable and other borrowings will fluctuate in response to
changes in market interest rates. In addition, changes in interest rate assumptions used in our equity index put option contract
models cause changes in reported liabilities with respect to those contracts. Increases and decreases in prevailing interest rates
generally translate into decreases and increases in fair values of those instruments. Additionally, fair values of interest rate
sensitive instruments may be affected by the creditworthiness of the issuer, prepayment options, relative values of alternative
investments, the liquidity of the instrument and other general market conditions. The fair values of fixed interest rate
instruments may be more sensitive to interest rate changes than variable rate instruments.
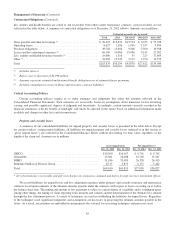
The following table summarizes the estimated effects of hypothetical changes in interest rates on our assets and liabilities
that are subject to interest rate risk. It is assumed that the interest rate changes occur immediately and uniformly to each
category of instrument containing interest rate risk, and that there are no significant changes to other factors used to determine
the value of the instrument. The hypothetical changes in interest rates do not reflect what could be deemed best or worst case
scenarios. Variations in interest rates could produce significant changes in the timing of repayments due to prepayment options
available. For these reasons, actual results might differ from those reflected in the table. Dollars are in millions.
Estimated Fair Value after
Hypothetical Change in Interest Rates
(bp=basis points)
Fair Value
100 bp
decrease
100 bp
increase
200 bp
increase
300 bp
increase
December 31, 2012
Assets:
Investments in fixed maturity securities .................... $32,291 $33,095 $31,456 $30,653 $29,937
Other investments (1) .................................. 14,740 15,241 14,206 13,683 13,189
Loans and finance receivables ........................... 11,991 12,410 11,598 11,229 10,883
Liabilities:
Notes payable and other borrowings:
Insurance and other ................................ 14,284 14,794 13,815 13,398 13,018
Railroad, utilities and energy ........................ 42,074 46,268 38,519 35,495 32,902
Finance and financial products ....................... 14,005 14,597 13,432 12,950 12,519
Equity index put option contracts ......................... 7,502 8,980 6,226 5,131 4,198
December 31, 2011
Assets:
Investments in fixed maturity securities .................... $32,188 $32,966 $31,371 $30,569 $29,859
Other investments (1) .................................. 13,927 14,501 13,382 12,863 12,374
Loans and finance receivables ........................... 13,126 13,584 12,696 12,292 11,913
Liabilities:
Notes payable and other borrowings:
Insurance and other ................................ 14,334 14,810 13,908 13,525 13,176
Railroad, utilities and energy ........................ 38,257 42,023 35,096 32,403 30,097
Finance and financial products ....................... 14,959 15,541 14,513 14,106 13,732
Equity index put option contracts ......................... 8,499 10,238 7,007 5,733 4,655
(1) Includes other investments that are subject to a significant level of interest rate risk.
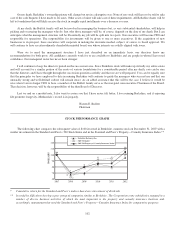
Equity Price Risk
Historically, we have maintained large amounts of invested assets in exchange traded equity securities. Strategically, we
strive to invest in businesses that possess excellent economics, with able and honest management and at sensible prices and
94