Berkshire Hathaway 2012 Annual Report Download - page 46
Download and view the complete annual report
Please find page 46 of the 2012 Berkshire Hathaway annual report below. You can navigate through the pages in the report by either clicking on the pages listed below, or by using the keyword search tool below to find specific information within the annual report.-
 1
1 -
2
-
3
-
4
-
5
-
6
-
7
-
8
-
9
-
10
-
11
-
12
-
13
-
14
-
15
-
16
-
17
-
18
-
19
-
20
-
21
-
22
-
23
-
24
-
25
-
26
-
27
-
28
-
29
-
30
-
31
-
32
-
33
-
34
-
35
-
 36
36 -
 37
37 -
 38
38 -
 39
39 -
 40
40 -
 41
41 -
 42
42 -
 43
43 -
 44
44 -
 45
45 -
 46
46 -
 47
47 -
 48
48 -
 49
49 -
 50
50 -
 51
51 -
 52
52 -
 53
53 -
 54
54 -
 55
55 -
 56
56 -
57
-
58
-
59
-
60
-
61
-
62
-
63
-
64
-
65
-
66
-
67
-
68
-
69
-
70
-
71
-
72
-
73
-
74
-
75
-
76
-
77
-
78
-
79
-
80
-
81
-
82
-
83
-
84
-
85
-
86
-
87
-
88
-
89
-
90
-
91
-
92
-
93
-
94
-
95
-
96
-
97
-
98
-
99
-
100
-
101
-
102
-
103
-
104
-
105
-
106
-
107
-
108
-
109
-
110
-
111
-
112
 |
 |

Notes to Consolidated Financial Statements (Continued)
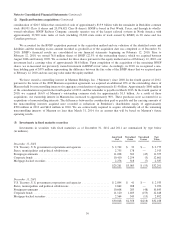
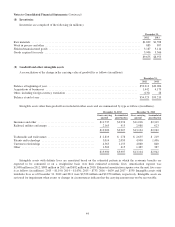
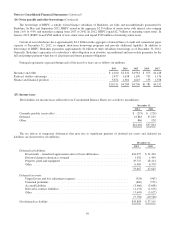
(8) Inventories
Inventories are comprised of the following (in millions).
December 31,
2012 2011
Raw materials ............................................................................ $1,699 $1,598
Work in process and other ................................................................... 883 897
Finished manufactured goods ................................................................ 3,187 3,114
Goods acquired for resale ................................................................... 3,906 3,366
$9,675 $8,975
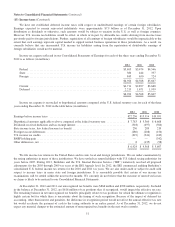
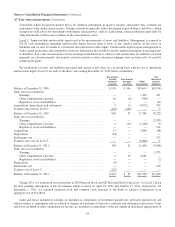
(9) Goodwill and other intangible assets
A reconciliation of the change in the carrying value of goodwill is as follows (in millions).
December 31,
2012 2011
Balance at beginning of year ............................................................... $53,213 $49,006
Acquisitions of businesses ................................................................ 1,442 4,179
Other, including foreign currency translation .................................................. (132) 28
Balance at end of year .................................................................... $54,523 $53,213
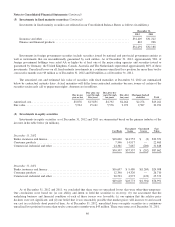
Intangible assets other than goodwill are included in other assets and are summarized by type as follows (in millions).
December 31, 2012 December 31, 2011
Gross carrying
amount
Accumulated
amortization
Gross carrying
amount
Accumulated
amortization
Insurance and other ........................................ $11,737 $2,994 $11,016 $2,319
Railroad, utilities and energy ................................. 2,163 913 2,088 623
$13,900 $3,907 $13,104 $2,942
Trademarks and trade names ................................. $ 2,819 $ 278 $ 2,655 $ 219
Patents and technology ..................................... 5,014 2,059 4,900 1,496
Customer relationships ..................................... 4,565 1,155 4,060 840
Other ................................................... 1,502 415 1,489 387
$13,900 $3,907 $13,104 $2,942
Intangible assets with definite lives are amortized based on the estimated pattern in which the economic benefits are
expected to be consumed or on a straight-line basis over their estimated economic lives. Amortization expense was
$1,008 million in 2012, $809 million in 2011 and $692 million in 2010. Estimated amortization expense over the next five years
is as follows (in millions): 2013 – $1,190; 2014 – $1,076; 2015 – $733; 2016 – $639 and 2017 – $539. Intangible assets with
indefinite lives as of December 31, 2012 and 2011 were $2,328 million and $2,250 million, respectively. Intangible assets are
reviewed for impairment when events or changes in circumstances indicate that the carrying amount may not be recoverable.
44