Berkshire Hathaway 2012 Annual Report Download - page 54
Download and view the complete annual report
Please find page 54 of the 2012 Berkshire Hathaway annual report below. You can navigate through the pages in the report by either clicking on the pages listed below, or by using the keyword search tool below to find specific information within the annual report.-
 1
1 -
2
-
3
-
4
-
5
-
6
-
7
-
8
-
9
-
10
-
11
-
12
-
13
-
14
-
15
-
16
-
17
-
18
-
19
-
20
-
21
-
22
-
23
-
24
-
25
-
26
-
27
-
28
-
29
-
30
-
31
-
32
-
33
-
34
-
35
-
36
-
37
-
38
-
39
-
40
-
41
-
42
-
43
-
 44
44 -
 45
45 -
 46
46 -
 47
47 -
 48
48 -
 49
49 -
 50
50 -
 51
51 -
 52
52 -
 53
53 -
 54
54 -
 55
55 -
 56
56 -
 57
57 -
 58
58 -
 59
59 -
 60
60 -
 61
61 -
 62
62 -
 63
63 -
 64
64 -
65
-
66
-
67
-
68
-
69
-
70
-
71
-
72
-
73
-
74
-
75
-
76
-
77
-
78
-
79
-
80
-
81
-
82
-
83
-
84
-
85
-
86
-
87
-
88
-
89
-
90
-
91
-
92
-
93
-
94
-
95
-
96
-
97
-
98
-
99
-
100
-
101
-
102
-
103
-
104
-
105
-
106
-
107
-
108
-
109
-
110
-
111
-
112
 |
 |

Notes to Consolidated Financial Statements (Continued)
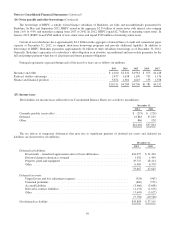
(16) Dividend restrictions – Insurance subsidiaries
Payments of dividends by our insurance subsidiaries are restricted by insurance statutes and regulations. Without prior
regulatory approval, our principal insurance subsidiaries may declare up to approximately $10.6 billion as ordinary dividends
before the end of 2013.
Combined shareholders’ equity of U.S. based property/casualty insurance subsidiaries determined pursuant to statutory
accounting rules (Statutory Surplus as Regards Policyholders) was approximately $106 billion at December 31, 2012 and
$95 billion at December 31, 2011. Statutory surplus differs from the corresponding amount determined on the basis of GAAP
due to differences in accounting for certain assets and liabilities. For instance, deferred charges reinsurance assumed, deferred
policy acquisition costs, certain unrealized gains and losses on investments in fixed maturity securities and related deferred
income taxes are recognized for GAAP but not for statutory reporting purposes. In addition, under statutory reporting, goodwill
is amortized over 10 years, whereas under GAAP, goodwill is not amortized and is subject to periodic tests for impairment.
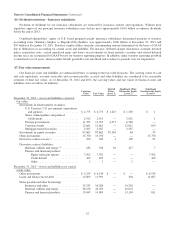
(17) Fair value measurements
Our financial assets and liabilities are summarized below according to the fair value hierarchy. The carrying values of cash
and cash equivalents, accounts receivable and accounts payable, accruals and other liabilities are considered to be reasonable
estimates of their fair values. As of December 31, 2012 and 2011, the carrying values and fair values of financial assets and
liabilities were as follows (in millions).
Carrying
Value Fair Value
Quoted
Prices
(Level 1)
Significant Other
Observable Inputs
(Level 2)
Significant
Unobservable Inputs
(Level 3)
December 31, 2012—Assets and liabilities carried at
fair value:
Investments in fixed maturity securities:
U.S. Treasury, U.S. government corporations
and agencies ........................ $ 2,775 $ 2,775 $ 1,225 $ 1,549 $ 1
States, municipalities and political
subdivisions ......................... 2,913 2,913 — 2,912 1
Foreign governments .................... 11,355 11,355 4,571 6,784 —
Corporate bonds ....................... 12,661 12,661 — 12,011 650
Mortgage-backed securities .............. 2,587 2,587 — 2,587 —
Investments in equity securities ............... 87,662 87,662 87,563 64 35
Other investments .......................... 15,750 15,750 — — 15,750
Derivative contract assets (1) .................. 220 220 1 128 91
Derivative contract liabilities:
Railroad, utilities and energy (2) ........... 234 234 10 217 7
Finance and financial products:
Equity index put options ............. 7,502 7,502 — — 7,502
Credit default ..................... 429 429 — — 429
Other ............................ 2 2 — 2 —
December 31, 2012—Assets and liabilities not carried
at fair value:
Other investments .......................... $ 5,259 $ 6,134 $ — $ — $ 6,134
Loans and finance receivables ................ 12,809 11,991 — 304 11,687
Notes payable and other borrowings:
Insurance and other ..................... 13,535 14,284 — 14,284 —
Railroad, utilities and energy ............. 36,156 42,074 — 42,074 —
Finance and financial products ............ 13,045 14,005 — 13,194 811
52