Berkshire Hathaway 2012 Annual Report Download - page 76
Download and view the complete annual report
Please find page 76 of the 2012 Berkshire Hathaway annual report below. You can navigate through the pages in the report by either clicking on the pages listed below, or by using the keyword search tool below to find specific information within the annual report.-
 1
1 -
2
-
3
-
4
-
5
-
6
-
7
-
8
-
9
-
10
-
11
-
12
-
13
-
14
-
15
-
16
-
17
-
18
-
19
-
20
-
21
-
22
-
23
-
24
-
25
-
26
-
27
-
28
-
29
-
30
-
31
-
32
-
33
-
34
-
35
-
36
-
37
-
38
-
39
-
40
-
41
-
42
-
43
-
44
-
45
-
46
-
47
-
48
-
49
-
50
-
51
-
52
-
53
-
54
-
55
-
56
-
57
-
58
-
59
-
60
-
61
-
62
-
63
-
64
-
65
-
 66
66 -
 67
67 -
 68
68 -
 69
69 -
 70
70 -
 71
71 -
 72
72 -
 73
73 -
 74
74 -
 75
75 -
 76
76 -
 77
77 -
 78
78 -
 79
79 -
 80
80 -
 81
81 -
 82
82 -
 83
83 -
 84
84 -
 85
85 -
 86
86 -
87
-
88
-
89
-
90
-
91
-
92
-
93
-
94
-
95
-
96
-
97
-
98
-
99
-
100
-
101
-
102
-
103
-
104
-
105
-
106
-
107
-
108
-
109
-
110
-
111
-
112
 |
 |
Management’s Discussion (Continued)
Railroad (“Burlington Northern Santa Fe”) (Continued)
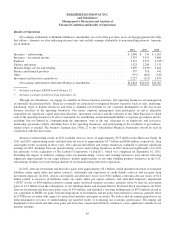
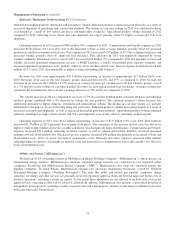
attributable to higher domestic intermodal and automotive volume. Industrial products volume increased primarily as a result of
increased shipments of petroleum and construction products. The decline in coal unit volume in 2012 was attributed to lower
coal demand as a result of low natural gas prices and high utility stockpiles. Agricultural product volume declined in 2012
compared to 2011, reflecting lower wheat and corn shipments for export partially offset by higher soybean and U.S. corn
shipments.
Operating expenses in 2012 increased $588 million (4%) compared to 2011. Compensation and benefits expenses in 2012
increased $190 million (4%) over 2011 due to the increased volume as well as wage inflation, partially offset by increased
productivity and lower weather-related costs. Fuel expenses in 2012 increased $192 million (4.5%) due to higher fuel prices and
increased volume, partially offset by improved fuel efficiency. Fuel efficiency in 2011 was negatively impacted by severe
weather conditions. Purchased services costs in 2012 increased $156 million (7%) compared to 2011 due primarily to increased
volume, increased purchased transportation services of BNSF Logistics, a wholly-owned third party logistics company, and
increased equipment maintenance costs, partially offset by lower weather-related costs. Interest expense in 2012 increased $63
million (11%) versus 2011, due principally to higher average outstanding debt balances.
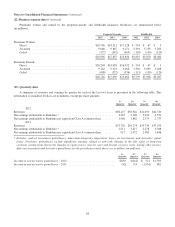
Revenues for 2011 were approximately $19.5 billion, representing an increase of approximately $2.7 billion (16%) over
2010. Revenues from each of the four business groups increased between 8% and 19% as compared to 2010. Overall, the
increases in revenues in 2011 reflected a 12% increase in average revenues per car/unit across all four business groups, as well
as a 3% increase in the volume of cars/units handled. Revenues in each period include fuel surcharges. Average revenues per
car/unit in 2011 included the effects of fuel surcharge increases of 35% in 2011 as compared to 2010.
The volume increase in 2011 is comprised of increases of 7% in cars/units handled in the consumer products and industrial
products groups combined with a 4% decrease in volume for coal products. The consumer products volume increase was
attributable primarily to higher domestic intermodal and international volume. The decline in coal unit volume was partially
attributable to the impacts of severe flooding along key coal routes. Industrial products volume increased primarily as a result of
increased steel and sand shipments, as well as increased demand in petroleum products. Agricultural product volume remained
relatively unchanged, as higher wheat exports and U.S. corn shipments were mostly offset by declining soybean exports.
Operating expenses in 2011 were $14.2 billion, representing an increase of $1.9 billion (15%) over 2010. Fuel expenses
increased $1.3 billion in 2011 primarily due to higher fuel prices. The remainder of the increase in fuel costs was driven by
higher overall freight volumes and severe weather conditions, which negatively impacted efficiency. Compensation and benefits
expenses increased $311 million, reflecting increased volume, as well as salaries and benefits inflation, increased personnel
training costs and flood-related costs. Purchased services expenses increased $49 million due primarily to increased volume and
flood-related costs, offset by lower locomotive maintenance costs. Materials and other expenses increased $186 million,
reflecting higher locomotive and freight car material costs and increased crew transportation, travel and casualty costs offset by
lower environmental costs.
Utilities and Energy (“MidAmerican”)
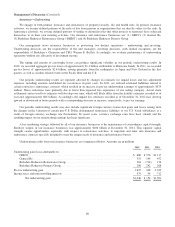
We hold an 89.8% ownership interest in MidAmerican Energy Holdings Company (“MidAmerican”), which operates an
international energy business. MidAmerican’s domestic regulated energy interests are comprised of two regulated utility
companies, PacifiCorp and MidAmerican Energy Company (“MEC”). MidAmerican also owns two interstate natural gas
pipeline companies. In Great Britain, MidAmerican operates two electricity distribution businesses, owned by Northern
Powergrid Holdings Company (“Northern Powergrid”). The rates that utility and natural gas pipeline companies charge
customers for energy and other services are generally subject to regulatory approval. Rates are based in large part on the costs of
business operations, including a return on capital. To the extent these operations are not allowed to include such costs in the
approved rates, operating results will be adversely affected. In addition, MidAmerican also operates a diversified portfolio of
independent power projects, including recently-acquired solar and wind projects, and the second-largest residential real estate
brokerage firm in the United States.
74