Berkshire Hathaway 2012 Annual Report Download - page 55
Download and view the complete annual report
Please find page 55 of the 2012 Berkshire Hathaway annual report below. You can navigate through the pages in the report by either clicking on the pages listed below, or by using the keyword search tool below to find specific information within the annual report.-
 1
1 -
2
-
3
-
4
-
5
-
6
-
7
-
8
-
9
-
10
-
11
-
12
-
13
-
14
-
15
-
16
-
17
-
18
-
19
-
20
-
21
-
22
-
23
-
24
-
25
-
26
-
27
-
28
-
29
-
30
-
31
-
32
-
33
-
34
-
35
-
36
-
37
-
38
-
39
-
40
-
41
-
42
-
43
-
44
-
 45
45 -
 46
46 -
 47
47 -
 48
48 -
 49
49 -
 50
50 -
 51
51 -
 52
52 -
 53
53 -
 54
54 -
 55
55 -
 56
56 -
 57
57 -
 58
58 -
 59
59 -
 60
60 -
 61
61 -
 62
62 -
 63
63 -
 64
64 -
 65
65 -
66
-
67
-
68
-
69
-
70
-
71
-
72
-
73
-
74
-
75
-
76
-
77
-
78
-
79
-
80
-
81
-
82
-
83
-
84
-
85
-
86
-
87
-
88
-
89
-
90
-
91
-
92
-
93
-
94
-
95
-
96
-
97
-
98
-
99
-
100
-
101
-
102
-
103
-
104
-
105
-
106
-
107
-
108
-
109
-
110
-
111
-
112
 |
 |

Notes to Consolidated Financial Statements (Continued)
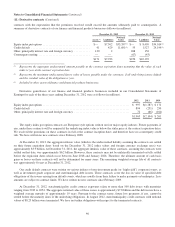
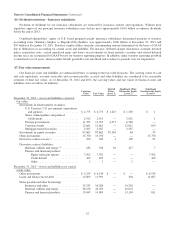
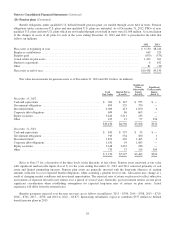
(17) Fair value measurements (Continued)
Carrying
Value Fair Value
Quoted
Prices
(Level 1)
Significant Other
Observable Inputs
(Level 2)
Significant
Unobservable Inputs
(Level 3)
December 31, 2011—Assets and liabilities carried at
fair value:
Investments in fixed maturity securities:
U.S. Treasury, U.S. government corporations
and agencies ........................ $ 2,935 $ 2,935 $ 843 $ 2,090 $ 2
States, municipalities and political
subdivisions ......................... 3,070 3,070 — 3,069 1
Foreign governments .................... 10,843 10,843 4,444 6,265 134
Corporate bonds ....................... 12,448 12,448 — 11,801 647
Mortgage-backed securities .............. 2,892 2,892 — 2,892 —
Investments in equity securities ............... 76,991 76,991 76,906 63 22
Other investments .......................... 11,669 11,669 — — 11,669
Derivative contract assets (1) .................. 327 327 — 205 122
Derivative contract liabilities:
Railroad, utilities and energy (2) ........... 336 336 12 320 4
Finance and financial products:
Equity index put options ............. 8,499 8,499 — — 8,499
Credit default ..................... 1,527 1,527 — — 1,527
Other ............................ 113 113 — 113 —
(1)Included in other assets.
(2) Included in accounts payable, accruals and other liabilities.
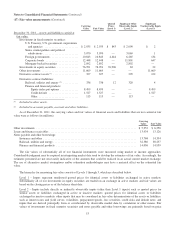
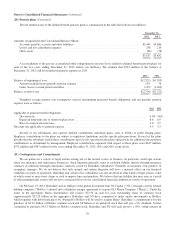
As of December 31, 2011, the carrying values and fair values of financial assets and liabilities that are not carried at fair
value were as follows (in millions).
Carrying
Value Fair Value
Other investments ...................................................................... $ 5,252 $ 6,258
Loans and finance receivables ............................................................. 13,934 13,126
Notes payable and other borrowings:
Insurance and other ................................................................. 13,768 14,334
Railroad, utilities and energy .......................................................... 32,580 38,257
Finance and financial products ........................................................ 14,036 14,959
The fair values of substantially all of our financial instruments were measured using market or income approaches.
Considerable judgment may be required in interpreting market data used to develop the estimates of fair value. Accordingly, the
estimates presented are not necessarily indicative of the amounts that could be realized in an actual current market exchange.
The use of alternative market assumptions and/or estimation methodologies may have a material effect on the estimated fair
value.
The hierarchy for measuring fair value consists of Levels 1 through 3, which are described below.
Level 1 – Inputs represent unadjusted quoted prices for identical assets or liabilities exchanged in active markets.
Substantially all of our investments in equity securities are traded on an exchange in active markets and fair values are
based on the closing prices as of the balance sheet date.
Level 2 – Inputs include directly or indirectly observable inputs (other than Level 1 inputs) such as quoted prices for
similar assets or liabilities exchanged in active or inactive markets; quoted prices for identical assets or liabilities
exchanged in inactive markets; other inputs that may be considered in fair value determinations of the assets or liabilities,
such as interest rates and yield curves, volatilities, prepayment speeds, loss severities, credit risks and default rates; and
inputs that are derived principally from or corroborated by observable market data by correlation or other means. Fair
values of investments in fixed maturity securities and notes payable and other borrowings are primarily based on price
53