Berkshire Hathaway 2012 Annual Report Download - page 42
Download and view the complete annual report
Please find page 42 of the 2012 Berkshire Hathaway annual report below. You can navigate through the pages in the report by either clicking on the pages listed below, or by using the keyword search tool below to find specific information within the annual report.-
 1
1 -
2
-
3
-
4
-
5
-
6
-
7
-
8
-
9
-
10
-
11
-
12
-
13
-
14
-
15
-
16
-
17
-
18
-
19
-
20
-
21
-
22
-
23
-
24
-
25
-
26
-
27
-
28
-
29
-
30
-
31
-
 32
32 -
 33
33 -
 34
34 -
 35
35 -
 36
36 -
 37
37 -
 38
38 -
 39
39 -
 40
40 -
 41
41 -
 42
42 -
 43
43 -
 44
44 -
 45
45 -
 46
46 -
 47
47 -
 48
48 -
 49
49 -
 50
50 -
 51
51 -
 52
52 -
53
-
54
-
55
-
56
-
57
-
58
-
59
-
60
-
61
-
62
-
63
-
64
-
65
-
66
-
67
-
68
-
69
-
70
-
71
-
72
-
73
-
74
-
75
-
76
-
77
-
78
-
79
-
80
-
81
-
82
-
83
-
84
-
85
-
86
-
87
-
88
-
89
-
90
-
91
-
92
-
93
-
94
-
95
-
96
-
97
-
98
-
99
-
100
-
101
-
102
-
103
-
104
-
105
-
106
-
107
-
108
-
109
-
110
-
111
-
112
 |
 |

Notes to Consolidated Financial Statements (Continued)
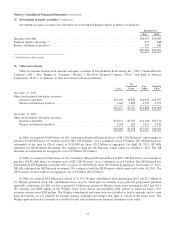
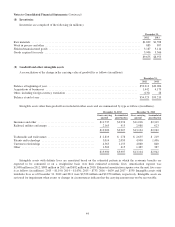
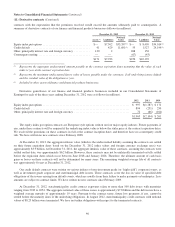
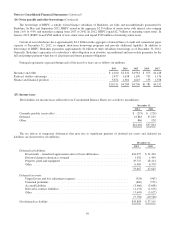
(3) Investments in fixed maturity securities (Continued)
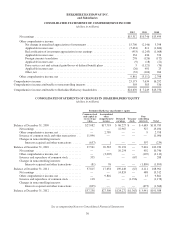
Investments in fixed maturity securities are reflected in our Consolidated Balance Sheets as follows (in millions).
December 31,
2012 2011
Insurance and other ............................................................ $31,449 $31,222
Finance and financial products ................................................... 842 966
$32,291 $32,188
Investments in foreign government securities include securities issued by national and provincial government entities as
well as instruments that are unconditionally guaranteed by such entities. As of December 31, 2012, approximately 96% of
foreign government holdings were rated AA or higher by at least one of the major rating agencies and securities issued or
guaranteed by Germany, the United Kingdom, Canada, Australia and The Netherlands represented approximately 80% of these
investments. Unrealized losses on all fixed maturity investments in a continuous unrealized loss position for more than twelve
consecutive months were $9 million as of December 31, 2012 and $20 million as of December 31, 2011.
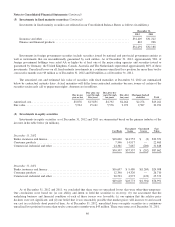
The amortized cost and estimated fair value of securities with fixed maturities at December 31, 2012 are summarized
below by contractual maturity dates. Actual maturities will differ from contractual maturities because issuers of certain of the
securities retain early call or prepayment rights. Amounts are in millions.
Due in one
year or less
Due after one
year through
five years
Due after five
years through
ten years
Due after
ten years
Mortgage-backed
securities Total
Amortized cost .......................... $5,878 $13,851 $4,792 $2,464 $2,276 $29,261
Fair value .............................. 5,994 15,161 5,576 2,973 2,587 32,291
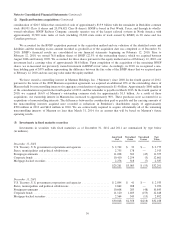
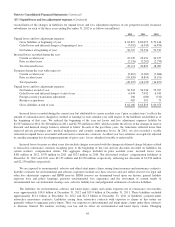
(4) Investments in equity securities
Investments in equity securities as of December 31, 2012 and 2011 are summarized based on the primary industry of the
investee in the table below (in millions).
Cost Basis
Unrealized
Gains
Unrealized
Losses
Fair
Value
December 31, 2012
Banks, insurance and finance ........................................... $18,600 $14,753 $ (2) $33,351
Consumer products ................................................... 7,546 14,917 — 22,463
Commercial, industrial and other ........................................ 24,361 7,687 (200) 31,848
$50,507 $37,357 $ (202) $87,662
December 31, 2011
Banks, insurance and finance ........................................... $16,697 $ 9,480 $(1,269) $24,908
Consumer products ................................................... 12,390 14,320 — 26,710
Commercial, industrial and other ........................................ 20,523 4,973 (123) 25,373
$49,610 $28,773 $(1,392) $76,991
As of December 31, 2012 and 2011, we concluded that there were no unrealized losses that were other-than-temporary.
Our conclusions were based on: (a) our ability and intent to hold the securities to recovery; (b) our assessment that the
underlying business and financial condition of each of these issuers was favorable; (c) our opinion that the relative price
declines were not significant; and (d) our belief that it was reasonably possible that market prices will increase to and exceed
our cost in a relatively short period of time. As of December 31, 2012, unrealized losses on equity securities in a continuous
unrealized loss position for more than twelve consecutive months were $45 million. There were none as of December 31, 2011.
40