Berkshire Hathaway 2012 Annual Report Download - page 83
Download and view the complete annual report
Please find page 83 of the 2012 Berkshire Hathaway annual report below. You can navigate through the pages in the report by either clicking on the pages listed below, or by using the keyword search tool below to find specific information within the annual report.-
 1
1 -
2
-
3
-
4
-
5
-
6
-
7
-
8
-
9
-
10
-
11
-
12
-
13
-
14
-
15
-
16
-
17
-
18
-
19
-
20
-
21
-
22
-
23
-
24
-
25
-
26
-
27
-
28
-
29
-
30
-
31
-
32
-
33
-
34
-
35
-
36
-
37
-
38
-
39
-
40
-
41
-
42
-
43
-
44
-
45
-
46
-
47
-
48
-
49
-
50
-
51
-
52
-
53
-
54
-
55
-
56
-
57
-
58
-
59
-
60
-
61
-
62
-
63
-
64
-
65
-
66
-
67
-
68
-
69
-
70
-
71
-
72
-
 73
73 -
 74
74 -
 75
75 -
 76
76 -
 77
77 -
 78
78 -
 79
79 -
 80
80 -
 81
81 -
 82
82 -
 83
83 -
 84
84 -
 85
85 -
 86
86 -
 87
87 -
 88
88 -
 89
89 -
 90
90 -
 91
91 -
 92
92 -
 93
93 -
94
-
95
-
96
-
97
-
98
-
99
-
100
-
101
-
102
-
103
-
104
-
105
-
106
-
107
-
108
-
109
-
110
-
111
-
112
 |
 |

Management’s Discussion (Continued)
Finance and Financial Products (Continued)
Earnings from our other finance business activities include investment income from a portfolio of fixed maturity and equity
investments, a commercial mortgage servicing business in which we own 50% and from a small portfolio of long-held
commercial real estate loans, which during the third and fourth quarters of 2012 were repaid in full. In addition, other earnings
include income from interest rate spreads charged to Clayton Homes on borrowings (approximately $11.2 billion as of
December 31, 2012) by a Berkshire financing subsidiary. The borrowings are used to fund loans to Clayton Homes.
Corresponding charges for this interest spread (approximately $90 million in 2012, $100 million in 2011 and $110 million in
2010) are reflected in Clayton Homes’ earnings. In addition, other earnings include guaranty fee income of $30 million in 2012,
$41 million in 2011 and $38 million in 2010 from NetJets. Corresponding expenses are included in NetJets’ results.
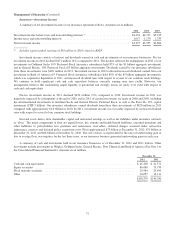
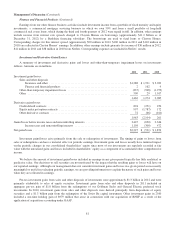
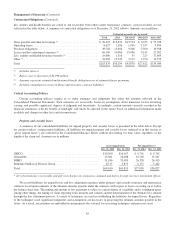
Investment and Derivative Gains/Losses
A summary of investment and derivative gains and losses and other-than-temporary impairment losses on investments
follows. Amounts are in millions.
2012 2011 2010
Investment gains/losses:
Sales and other disposals
Insurance and other ....................................................... $1,288 $ 1,991 $ 3,032
Finance and financial products .............................................. 2 162 9
Other-than-temporary impairment losses .......................................... (337) (908) (1,973)
Other ...................................................................... 509 29 1,017
1,462 1,274 2,085
Derivative gains/losses:
Credit default contracts ........................................................ 894 (251) 250
Equity index put option contracts ................................................ 997 (1,787) 172
Other derivative contracts ...................................................... 72 (66) (161)
1,963 (2,104) 261
Gains/losses before income taxes and noncontrolling interests ............................. 3,425 (830) 2,346
Income taxes and noncontrolling interests ..................................... 1,198 (309) 472
Net gains/losses .................................................................. $2,227 $ (521) $ 1,874
Investment gains/losses arise primarily from the sale or redemption of investments. The timing of gains or losses from
sales or redemptions can have a material effect on periodic earnings. Investment gains and losses usually have minimal impact
on the periodic changes in our consolidated shareholders’ equity since most of our investments are regularly recorded at fair
value with the unrealized gains and losses included in shareholders’ equity as a component of accumulated other comprehensive
income.
We believe the amount of investment gains/losses included in earnings in any given period typically has little analytical or
predictive value. Our decisions to sell securities are not motivated by the impact that the resulting gains or losses will have on
our reported earnings. Although our management does not consider investment gains and losses in a given period as necessarily
meaningful or useful in evaluating periodic earnings, we are providing information to explain the nature of such gains and losses
when they are reflected in earnings.
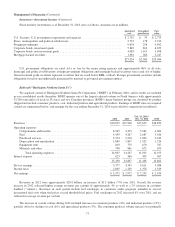
Pre-tax investment gains from sales and other disposals of investments were approximately $1.3 billion in 2012 and were
primarily attributable to sales of equity securities. Investment gains from sales and other disposals in 2011 included an
aggregate pre-tax gain of $1.8 billion from the redemptions of our Goldman Sachs and General Electric preferred stock
investments. In 2010, investment gains from sales and other disposals were derived principally from dispositions of equity
securities and a $1.3 billion gain from the redemption of the Swiss Re capital instrument. Other investment gains in 2010
included a one-time holding gain of $979 million that arose in connection with our acquisition of BNSF as a result of the
application of acquisition accounting under GAAP.
81