Berkshire Hathaway 2012 Annual Report Download - page 14
Download and view the complete annual report
Please find page 14 of the 2012 Berkshire Hathaway annual report below. You can navigate through the pages in the report by either clicking on the pages listed below, or by using the keyword search tool below to find specific information within the annual report.-
 1
1 -
2
-
3
-
 4
4 -
 5
5 -
 6
6 -
 7
7 -
 8
8 -
 9
9 -
 10
10 -
 11
11 -
 12
12 -
 13
13 -
 14
14 -
 15
15 -
 16
16 -
 17
17 -
 18
18 -
 19
19 -
 20
20 -
 21
21 -
 22
22 -
 23
23 -
 24
24 -
25
-
26
-
27
-
28
-
29
-
30
-
31
-
32
-
33
-
34
-
35
-
36
-
37
-
38
-
39
-
40
-
41
-
42
-
43
-
44
-
45
-
46
-
47
-
48
-
49
-
50
-
51
-
52
-
53
-
54
-
55
-
56
-
57
-
58
-
59
-
60
-
61
-
62
-
63
-
64
-
65
-
66
-
67
-
68
-
69
-
70
-
71
-
72
-
73
-
74
-
75
-
76
-
77
-
78
-
79
-
80
-
81
-
82
-
83
-
84
-
85
-
86
-
87
-
88
-
89
-
90
-
91
-
92
-
93
-
94
-
95
-
96
-
97
-
98
-
99
-
100
-
101
-
102
-
103
-
104
-
105
-
106
-
107
-
108
-
109
-
110
-
111
-
112
 |
 |

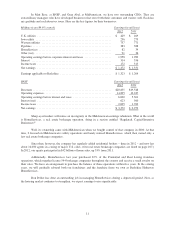
Manufacturing, Service and Retailing Operations
Our activities in this part of Berkshire cover the waterfront. Let’s look, though, at a summary balance sheet
and earnings statement for the entire group.
Balance Sheet 12/31/12 (in millions)
Assets Liabilities and Equity
Cash and equivalents .............. $ 5,338 Notes payable ............... $ 1,454
Accounts and notes receivable ....... 7,382 Other current liabilities ........ 8,527
Inventory ....................... 9,675 Total current liabilities ........ 9,981
Other current assets ............... 734
Total current assets ................ 23,129
Deferred taxes ............... 4,907
Goodwill and other intangibles ...... 26,017 Term debt and other liabilities . . 5,826
Fixed assets ..................... 18,871 Non-controlling interests ...... 2,062
Other assets ..................... 3,416 Berkshire equity ............. 48,657
$71,433 $71,433
Earnings Statement (in millions)
2012 2011* 2010
Revenues ............................................ $83,255 $72,406 $66,610
Operating expenses .................................... 76,978 67,239 62,225
Interest expense ....................................... 146 130 111
Pre-tax earnings ....................................... 6,131 5,037 4,274
Income taxes and non-controlling interests .................. 2,432 1,998 1,812
Net earnings .......................................... $ 3,699 $ 3,039 $ 2,462
*Includes earnings of Lubrizol from September 16.
Our income and expense data conforming to Generally Accepted Accounting Principles (“GAAP”) is on
page 29. In contrast, the operating expense figures above are non-GAAP. In particular, they exclude some
purchase-accounting items, primarily the amortization of certain intangible assets. We present the data in this
manner because Charlie and I believe the adjusted numbers more accurately reflect the real expenses and profits of
the businesses aggregated in the table.
I won’t explain all of the adjustments – some are small and arcane – but serious investors should
understand the disparate nature of intangible assets: Some truly deplete over time while others never lose value.
With software, for example, amortization charges are very real expenses. Charges against other intangibles such as
the amortization of customer relationships, however, arise through purchase-accounting rules and are clearly not real
expenses. GAAP accounting draws no distinction between the two types of charges. Both, that is, are recorded as
expenses when calculating earnings – even though from an investor’s viewpoint they could not be more different.
In the GAAP-compliant figures we show on page 29, amortization charges of $600 million for the
companies included in this section are deducted as expenses. We would call about 20% of these “real” – and indeed
that is the portion we have included in the table above – and the rest not. This difference has become significant
because of the many acquisitions we have made.
“Non-real” amortization expense also looms large at some of our major investees. IBM has made many
small acquisitions in recent years and now regularly reports “adjusted operating earnings,” a non-GAAP figure that
excludes certain purchase-accounting adjustments. Analysts focus on this number, as they should.
12