Berkshire Hathaway 2012 Annual Report Download - page 56
Download and view the complete annual report
Please find page 56 of the 2012 Berkshire Hathaway annual report below. You can navigate through the pages in the report by either clicking on the pages listed below, or by using the keyword search tool below to find specific information within the annual report.-
 1
1 -
2
-
3
-
4
-
5
-
6
-
7
-
8
-
9
-
10
-
11
-
12
-
13
-
14
-
15
-
16
-
17
-
18
-
19
-
20
-
21
-
22
-
23
-
24
-
25
-
26
-
27
-
28
-
29
-
30
-
31
-
32
-
33
-
34
-
35
-
36
-
37
-
38
-
39
-
40
-
41
-
42
-
43
-
44
-
45
-
 46
46 -
 47
47 -
 48
48 -
 49
49 -
 50
50 -
 51
51 -
 52
52 -
 53
53 -
 54
54 -
 55
55 -
 56
56 -
 57
57 -
 58
58 -
 59
59 -
 60
60 -
 61
61 -
 62
62 -
 63
63 -
 64
64 -
 65
65 -
 66
66 -
67
-
68
-
69
-
70
-
71
-
72
-
73
-
74
-
75
-
76
-
77
-
78
-
79
-
80
-
81
-
82
-
83
-
84
-
85
-
86
-
87
-
88
-
89
-
90
-
91
-
92
-
93
-
94
-
95
-
96
-
97
-
98
-
99
-
100
-
101
-
102
-
103
-
104
-
105
-
106
-
107
-
108
-
109
-
110
-
111
-
112
 |
 |

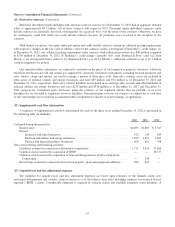
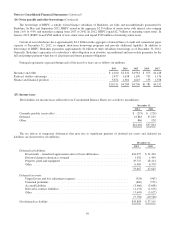
Notes to Consolidated Financial Statements (Continued)
(17) Fair value measurements (Continued)
evaluations which incorporate market prices for identical instruments in inactive markets and market data available for
instruments with similar characteristics. Pricing evaluations generally reflect discounted expected future cash flows, which
incorporate yield curves for instruments with similar characteristics, such as credit rating, estimated duration and yields for
other instruments of the issuer or entities in the same industry sector.
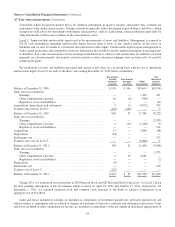
Level 3 – Inputs include unobservable inputs used in the measurement of assets and liabilities. Management is required to
use its own assumptions regarding unobservable inputs because there is little, if any, market activity in the assets or
liabilities and we may be unable to corroborate the related observable inputs. Unobservable inputs require management to
make certain projections and assumptions about the information that would be used by market participants in pricing assets
or liabilities. Fair value measurements of non-exchange traded derivative contracts and certain other investments are based
primarily on valuation models, discounted cash flow models or other valuation techniques that are believed to be used by
market participants.
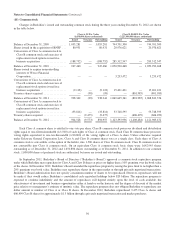
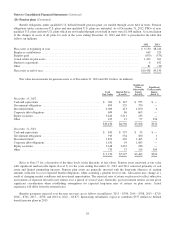
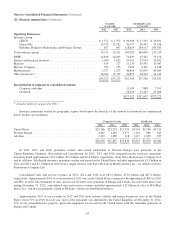
Reconciliations of assets and liabilities measured and carried at fair value on a recurring basis with the use of significant
unobservable inputs (Level 3) for each of the three years ending December 31, 2012 follow (in millions).
Investments
in fixed
maturity
securities
Investments
in equity
securities
Other
investments
Net
derivative
contract
liabilities
Balance at December 31, 2009 ...................................... $918 $304 $20,614 $(9,196)
Gains (losses) included in:
Earnings ................................................... — — 1,305 471
Other comprehensive income ................................... 16 (8) (358) —
Regulatory assets and liabilities ................................. — — — (33)
Acquisitions, dispositions and settlements ............................. 9 (1) (3,972) 533
Transfers into (out of) Level 3 ...................................... (142) (260) — 3
Balance at December 31, 2010 ...................................... 801 35 17,589 (8,222)
Gains (losses) included in:
Earnings ................................................... — — — (2,035)
Other comprehensive income ................................... 5 (13) (2,120) (3)
Regulatory assets and liabilities ................................. — — — 144
Acquisitions .................................................... 17 — 5,000 (68)
Dispositions .................................................... (39) — — —
Settlements, net .................................................. — — — 275
Transfers into (out of) Level 3 ...................................... — — (8,800) 1
Balance at December 31, 2011 ...................................... 784 22 11,669 (9,908)
Gains (losses) included in:
Earnings ................................................... — — — 1,873
Other comprehensive income ................................... 5 13 4,081 —
Regulatory assets and liabilities ................................. — — — (2)
Dispositions .................................................... (8) — — —
Settlements, net .................................................. — — — 190
Transfers out of Level 3 ........................................... (129) — — —
Balance at December 31, 2012 ...................................... $652 $ 35 $15,750 $(7,847)
During 2011, we transferred our investments in GS Preferred Stock and GE Preferred Stock from Level 3 to Level 2 given
the then pending redemptions of the investments which occurred on April 18, 2011 and October 17, 2011, respectively. On
September 1, 2011, we acquired preferred stock and common stock warrants of the Bank of America Corporation at an
aggregate cost of $5 billion.
Gains and losses included in earnings are included as components of investment gains/losses, derivative gains/losses and
other revenues, as appropriate and are related to changes in valuations of derivative contracts and settlement transactions. Gains
and losses included in other comprehensive income are included as components of the net change in unrealized appreciation of
54