Berkshire Hathaway 2012 Annual Report Download - page 48
Download and view the complete annual report
Please find page 48 of the 2012 Berkshire Hathaway annual report below. You can navigate through the pages in the report by either clicking on the pages listed below, or by using the keyword search tool below to find specific information within the annual report.-
 1
1 -
2
-
3
-
4
-
5
-
6
-
7
-
8
-
9
-
10
-
11
-
12
-
13
-
14
-
15
-
16
-
17
-
18
-
19
-
20
-
21
-
22
-
23
-
24
-
25
-
26
-
27
-
28
-
29
-
30
-
31
-
32
-
33
-
34
-
35
-
36
-
37
-
 38
38 -
 39
39 -
 40
40 -
 41
41 -
 42
42 -
 43
43 -
 44
44 -
 45
45 -
 46
46 -
 47
47 -
 48
48 -
 49
49 -
 50
50 -
 51
51 -
 52
52 -
 53
53 -
 54
54 -
 55
55 -
 56
56 -
 57
57 -
 58
58 -
59
-
60
-
61
-
62
-
63
-
64
-
65
-
66
-
67
-
68
-
69
-
70
-
71
-
72
-
73
-
74
-
75
-
76
-
77
-
78
-
79
-
80
-
81
-
82
-
83
-
84
-
85
-
86
-
87
-
88
-
89
-
90
-
91
-
92
-
93
-
94
-
95
-
96
-
97
-
98
-
99
-
100
-
101
-
102
-
103
-
104
-
105
-
106
-
107
-
108
-
109
-
110
-
111
-
112
 |
 |

Notes to Consolidated Financial Statements (Continued)
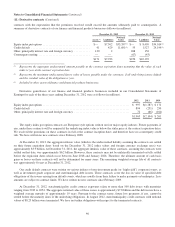
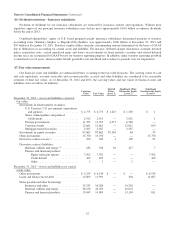
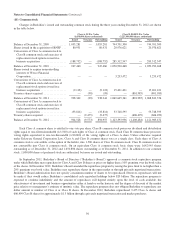
(11) Derivative contracts (Continued)
contracts with the expectation that the premiums received would exceed the amounts ultimately paid to counterparties. A
summary of derivative contracts of our finance and financial products businesses follows (in millions).
December 31, 2012 December 31, 2011
Assets (3) Liabilities
Notional
Value Assets (3) Liabilities
Notional
Value
Equity index put options ................................. $— $7,502 $33,357(1) $— $ 8,499 $34,014(1)
Credit default ......................................... 41 429 11,691(2) 55 1,527 24,194(2)
Other, principally interest rate and foreign currency ........... 130 2 268 156
Counterparty netting .................................... — — (67) (43)
$171 $7,933 $256 $10,139
(1) Represents the aggregate undiscounted amount payable at the contract expiration dates assuming that the value of each
index is zero at the contract expiration date.
(2) Represents the maximum undiscounted future value of losses payable under the contracts, if all underlying issuers default
and the residual value of the obligations is zero.
(3) Included in other assets of finance and financial products businesses.
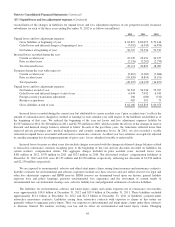
Derivative gains/losses of our finance and financial products businesses included in our Consolidated Statements of
Earnings for each of the three years ending December 31, 2012 were as follows (in millions).
2012 2011 2010
Equity index put options ............................................................. $ 997 $(1,787) $ 172
Credit default ..................................................................... 894 (251) 250
Other, principally interest rate and foreign currency ....................................... 72 (66) (161)
$1,963 $(2,104) $ 261
The equity index put option contracts are European style options written on four major equity indexes. Future payments, if
any, under these contracts will be required if the underlying index value is below the strike price at the contract expiration dates.
We received the premiums on these contracts in full at the contract inception dates and therefore have no counterparty credit
risk. We have written no new contracts since February 2008.
At December 31, 2012, the aggregate intrinsic value (which is the undiscounted liability assuming the contracts are settled
on their future expiration dates based on the December 31, 2012 index values and foreign currency exchange rates) was
approximately $3.9 billion. At December 31, 2011, the aggregate intrinsic value of these contracts, assuming the contracts were
settled on that date, was approximately $6.2 billion. However, these contracts may not be unilaterally terminated or fully settled
before the expiration dates which occur between June 2018 and January 2026. Therefore, the ultimate amount of cash basis
gains or losses on these contracts will not be determined for many years. The remaining weighted average life of all contracts
was approximately 8 years at December 31, 2012.
Our credit default contracts were written on various indexes of non-investment grade (or “high yield”) corporate issuers, as
well as investment grade corporate and state/municipal debt issuers. These contracts cover the loss in value of specified debt
obligations of the issuers arising from default events, which are usually from their failure to make payments or bankruptcy. Loss
amounts are subject to contract limits. We have written no new contracts since February 2009.
At December 31, 2012, state/municipality credit contract exposures relate to more than 500 debt issues with maturities
ranging from 2019 to 2054. The aggregate notional value of these issues is approximately $7.8 billion and the debt issues have a
weighted average maturity of approximately 19 years. Pursuant to the contract terms, future loss payments, if any, cannot be
settled before the maturity dates of the underlying obligations. In August 2012, state/municipality credit contracts with notional
values of $8.25 billion were terminated. We have no further obligations with respect to the terminated contracts.
46