Berkshire Hathaway 2012 Annual Report Download - page 70
Download and view the complete annual report
Please find page 70 of the 2012 Berkshire Hathaway annual report below. You can navigate through the pages in the report by either clicking on the pages listed below, or by using the keyword search tool below to find specific information within the annual report.-
 1
1 -
2
-
3
-
4
-
5
-
6
-
7
-
8
-
9
-
10
-
11
-
12
-
13
-
14
-
15
-
16
-
17
-
18
-
19
-
20
-
21
-
22
-
23
-
24
-
25
-
26
-
27
-
28
-
29
-
30
-
31
-
32
-
33
-
34
-
35
-
36
-
37
-
38
-
39
-
40
-
41
-
42
-
43
-
44
-
45
-
46
-
47
-
48
-
49
-
50
-
51
-
52
-
53
-
54
-
55
-
56
-
57
-
58
-
59
-
 60
60 -
 61
61 -
 62
62 -
 63
63 -
 64
64 -
 65
65 -
 66
66 -
 67
67 -
 68
68 -
 69
69 -
 70
70 -
 71
71 -
 72
72 -
 73
73 -
 74
74 -
 75
75 -
 76
76 -
 77
77 -
 78
78 -
 79
79 -
 80
80 -
81
-
82
-
83
-
84
-
85
-
86
-
87
-
88
-
89
-
90
-
91
-
92
-
93
-
94
-
95
-
96
-
97
-
98
-
99
-
100
-
101
-
102
-
103
-
104
-
105
-
106
-
107
-
108
-
109
-
110
-
111
-
112
 |
 |

Management’s Discussion (Continued)
Insurance—Underwriting (Continued)
GEICO (Continued)
catastrophe losses incurred. In 2011, bodily injury severities estimates generally increased in the three to six percent range over
2010, while physical damage severities increased in the three to five percent range. In 2011, catastrophe losses were $252 million
compared with $109 million in 2010. In 2011, underwriting expenses increased $239 million (9.4%) over 2010. The increase
reflected additional advertising and increased payroll costs related to generating new business and servicing existing business.
General Re
Through General Re, we conduct a reinsurance business offering property and casualty and life and health coverages to
clients worldwide. We write property and casualty reinsurance in North America on a direct basis through General Reinsurance
Corporation and internationally through Germany-based General Reinsurance AG and other wholly-owned affiliates. Property
and casualty reinsurance is also written through brokers with respect to Faraday in London. Life and health reinsurance is
written in North America through General Re Life Corporation and internationally through General Reinsurance AG. General
Re strives to generate underwriting profits in essentially all of its product lines. Our management does not evaluate underwriting
performance based upon market share and our underwriters are instructed to reject inadequately priced risks. General Re’s
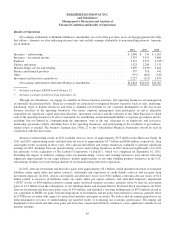
underwriting results are summarized in the following table. Amounts are in millions.
Premiums written Premiums earned Pre-tax underwriting gain
2012 2011 2010 2012 2011 2010 2012 2011 2010
Property/casualty ........................ $2,982 $2,910 $2,923 $2,904 $2,941 $2,979 $399 $ 7 $289
Life/health ............................. 3,002 2,909 2,709 2,966 2,875 2,714 (44) 137 163
$5,984 $5,819 $5,632 $5,870 $5,816 $5,693 $355 $144 $452
Property/casualty
Property/casualty premiums written in 2012 increased $72 million (2.5%), while premiums earned declined $37 million
(1.3%) from 2011. Excluding the effects of foreign currency exchange rate changes, premiums written increased $158 million
(5.4%) compared to 2011, which reflected increased volume in most of our major markets around the globe. Before the effects of
currency exchange, premiums earned in 2012 increased $61 million (2.1%) over 2011, which was primarily attributable to an increase
in European property treaty business. Price competition in most property and casualty lines persists and the volume of business written
in recent years has been less than our capacity. Our underwriters continue to exercise discipline by not accepting offers to write
business where prices are deemed inadequate. We remain prepared to increase premium volumes should market conditions improve.
Property/casualty operations produced net underwriting gains of $399 million in 2012 which consisted of $352 million of
gains from our property business and $47 million of gains from casualty/workers’ compensation business. Our property results
included $266 million of catastrophe losses primarily attributable to Hurricane Sandy, the earthquake in Northern Italy and
various tornadoes in the Midwest. The timing and magnitude of catastrophe and large individual losses has produced and is
expected to continue to produce significant volatility in periodic underwriting results. The underwriting gains from casualty/
workers’ compensation business included favorable run-off of prior years’ business, offset in part by $105 million of recurring
accretion of discounted workers’ compensation liabilities and deferred charge amortization on retroactive reinsurance contracts
written many years ago.
Premiums written in 2011 were relatively unchanged from 2010, while premiums earned in 2011 declined $38 million
(1.3%) from 2010. Excluding the effects of foreign currency exchange rate changes, premiums written and earned in 2011
declined $94 million (3.2%) and $132 million (4.4%), respectively, compared with 2010. The declines reflected lower premium
volume in North American property treaty business, substantially offset by higher premiums in European property lines and
broker market motor liability business.
Underwriting gains were $7 million in 2011 and consisted of a net underwriting gain of $127 million from casualty/workers’
compensation business substantially offset by a net underwriting loss of $120 million from property business. Our property results
included $861 million of catastrophe losses. The catastrophe losses were primarily attributable to the earthquakes in New Zealand
and Japan, as well as to weather related loss events in the United States, Europe and Australia. The underwriting gain of $127
million from casualty/workers’ compensation business reflected overall reductions in prior years’ loss reserve estimates, due
generally to lower than expected claim reports from cedants, which was partially offset by $111 million of accretion of discounted
workers’ compensation liabilities and deferred charge amortization.
68