Berkshire Hathaway 2012 Annual Report Download - page 8
Download and view the complete annual report
Please find page 8 of the 2012 Berkshire Hathaway annual report below. You can navigate through the pages in the report by either clicking on the pages listed below, or by using the keyword search tool below to find specific information within the annual report.-
 1
1 -
 2
2 -
 3
3 -
 4
4 -
 5
5 -
 6
6 -
 7
7 -
 8
8 -
 9
9 -
 10
10 -
 11
11 -
 12
12 -
 13
13 -
 14
14 -
 15
15 -
 16
16 -
 17
17 -
 18
18 -
 19
19 -
20
-
21
-
22
-
23
-
24
-
25
-
26
-
27
-
28
-
29
-
30
-
31
-
32
-
33
-
34
-
35
-
36
-
37
-
38
-
39
-
40
-
41
-
42
-
43
-
44
-
45
-
46
-
47
-
48
-
49
-
50
-
51
-
52
-
53
-
54
-
55
-
56
-
57
-
58
-
59
-
60
-
61
-
62
-
63
-
64
-
65
-
66
-
67
-
68
-
69
-
70
-
71
-
72
-
73
-
74
-
75
-
76
-
77
-
78
-
79
-
80
-
81
-
82
-
83
-
84
-
85
-
86
-
87
-
88
-
89
-
90
-
91
-
92
-
93
-
94
-
95
-
96
-
97
-
98
-
99
-
100
-
101
-
102
-
103
-
104
-
105
-
106
-
107
-
108
-
109
-
110
-
111
-
112
 |
 |
American business will do fine over time. And stocks will do well just as certainly, since their fate is tied
to business performance. Periodic setbacks will occur, yes, but investors and managers are in a game that
is heavily stacked in their favor. (The Dow Jones Industrials advanced from 66 to 11,497 in the 20th
Century, a staggering 17,320% increase that materialized despite four costly wars, a Great Depression and
many recessions. And don’t forget that shareholders received substantial dividends throughout the century
as well.)
Since the basic game is so favorable, Charlie and I believe it’s a terrible mistake to try to dance in and out
of it based upon the turn of tarot cards, the predictions of “experts,” or the ebb and flow of business
activity. The risks of being out of the game are huge compared to the risks of being in it.
My own history provides a dramatic example: I made my first stock purchase in the spring of 1942 when
the U.S. was suffering major losses throughout the Pacific war zone. Each day’s headlines told of more
setbacks. Even so, there was no talk about uncertainty; every American I knew believed we would prevail.
The country’s success since that perilous time boggles the mind: On an inflation-adjusted basis, GDP per
capita more than quadrupled between 1941 and 2012. Throughout that period, every tomorrow has been
uncertain. America’s destiny, however, has always been clear: ever-increasing abundance.
If you are a CEO who has some large, profitable project you are shelving because of short-term worries,
call Berkshire. Let us unburden you.
************
In summary, Charlie and I hope to build per-share intrinsic value by (1) improving the earning power of our
many subsidiaries; (2) further increasing their earnings through bolt-on acquisitions; (3) participating in the growth
of our investees; (4) repurchasing Berkshire shares when they are available at a meaningful discount from intrinsic
value; and (5) making an occasional large acquisition. We will also try to maximize results for you by rarely, if
ever, issuing Berkshire shares.
Those building blocks rest on a rock-solid foundation. A century hence, BNSF and MidAmerican Energy
will continue to play major roles in the American economy. Insurance, moreover, will always be essential for both
businesses and individuals – and no company brings greater resources to that arena than Berkshire. As we view
these and other strengths, Charlie and I like your company’s prospects.
Intrinsic Business Value
As much as Charlie and I talk about intrinsic business value, we cannot tell you precisely what that number
is for Berkshire shares (or, for that matter, any other stock). In our 2010 annual report, however, we laid out the
three elements – one of which was qualitative – that we believe are the keys to a sensible estimate of Berkshire’s
intrinsic value. That discussion is reproduced in full on pages 104-105.
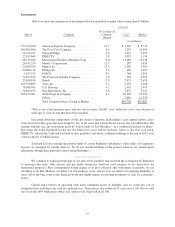
Here is an update of the two quantitative factors: In 2012 our per-share investments increased 15.7% to
$113,786, and our per-share pre-tax earnings from businesses other than insurance and investments also increased
15.7% to $8,085.
Since 1970, our per-share investments have increased at a rate of 19.4% compounded annually, and our
per-share earnings figure has grown at a 20.8% clip. It is no coincidence that the price of Berkshire stock over the
42-year period has increased at a rate very similar to that of our two measures of value. Charlie and I like to see
gains in both areas, but our strong emphasis will always be on building operating earnings.
************
Now, let’s examine the four major sectors of our operations. Each has vastly different balance sheet and
income characteristics from the others. Lumping them together therefore impedes analysis. So we’ll present them
as four separate businesses, which is how Charlie and I view them.
6