Berkshire Hathaway 2012 Annual Report Download - page 59
Download and view the complete annual report
Please find page 59 of the 2012 Berkshire Hathaway annual report below. You can navigate through the pages in the report by either clicking on the pages listed below, or by using the keyword search tool below to find specific information within the annual report.-
 1
1 -
2
-
3
-
4
-
5
-
6
-
7
-
8
-
9
-
10
-
11
-
12
-
13
-
14
-
15
-
16
-
17
-
18
-
19
-
20
-
21
-
22
-
23
-
24
-
25
-
26
-
27
-
28
-
29
-
30
-
31
-
32
-
33
-
34
-
35
-
36
-
37
-
38
-
39
-
40
-
41
-
42
-
43
-
44
-
45
-
46
-
47
-
48
-
 49
49 -
 50
50 -
 51
51 -
 52
52 -
 53
53 -
 54
54 -
 55
55 -
 56
56 -
 57
57 -
 58
58 -
 59
59 -
 60
60 -
 61
61 -
 62
62 -
 63
63 -
 64
64 -
 65
65 -
 66
66 -
 67
67 -
 68
68 -
 69
69 -
70
-
71
-
72
-
73
-
74
-
75
-
76
-
77
-
78
-
79
-
80
-
81
-
82
-
83
-
84
-
85
-
86
-
87
-
88
-
89
-
90
-
91
-
92
-
93
-
94
-
95
-
96
-
97
-
98
-
99
-
100
-
101
-
102
-
103
-
104
-
105
-
106
-
107
-
108
-
109
-
110
-
111
-
112
 |
 |

Notes to Consolidated Financial Statements (Continued)
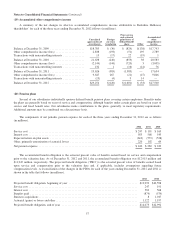
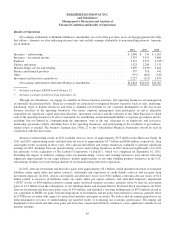
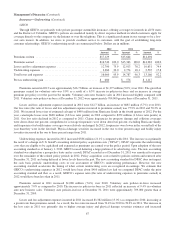
(19) Accumulated other comprehensive income
A summary of the net changes in after-tax accumulated comprehensive income attributable to Berkshire Hathaway
shareholders’ for each of the three years ending December 31, 2012 follows (in millions).
Unrealized
appreciation of
investments
Foreign
currency
translation
Prior service
and actuarial
gains/losses of
defined benefit
plans Other
Accumulated
other
comprehensive
income
Balance at December 31, 2009 ........................ $18,785 $ (30) $ (824) $(138) $17,793
Other comprehensive income (loss) .................... 2,838 (193) (51) 195 2,789
Transactions with noncontrolling interests ............... 15 (17) 22 (19) 1
Balance at December 31, 2010 ........................ 21,638 (240) (853) 38 20,583
Other comprehensive income (loss) .................... (2,144) (144) (720) 3 (3,005)
Transactions with noncontrolling interests ............... 132 1 (16) (41) 76
Balance at December 31, 2011 ........................ 19,626 (383) (1,589) — 17,654
Other comprehensive income (loss) .................... 9,647 267 (21) (47) 9,846
Transactions with noncontrolling interests ............... (19) (4) 9 14 —
Balance at December 31, 2012 ........................ $29,254 $(120) $(1,601) $ (33) $27,500
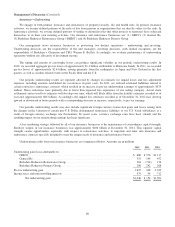
(20) Pension plans
Several of our subsidiaries individually sponsor defined benefit pension plans covering certain employees. Benefits under
the plans are generally based on years of service and compensation, although benefits under certain plans are based on years of
service and fixed benefit rates. Our subsidiaries make contributions to the plans, generally, to meet regulatory requirements.
Additional amounts may be contributed on a discretionary basis.
The components of net periodic pension expense for each of the three years ending December 31, 2012 are as follows
(in millions).
2012 2011 2010
Service cost ......................................................................... $247 $191 $165
Interest cost ......................................................................... 583 568 543
Expected return on plan assets .......................................................... (610) (579) (528)
Other, primarily amortization of actuarial losses ............................................ 220 102 69
Net pension expense .................................................................. $440 $282 $249
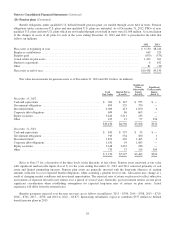
The accumulated benefit obligation is the actuarial present value of benefits earned based on service and compensation
prior to the valuation date. As of December 31, 2012 and 2011, the accumulated benefit obligation was $12,915 million and
$11,947 million, respectively. The projected benefit obligation (“PBO”) is the actuarial present value of benefits earned based
upon service and compensation prior to the valuation date and, if applicable, includes assumptions regarding future
compensation levels. A reconciliation of the changes in the PBOs for each of the years ending December 31, 2012 and 2011 is
shown in the table that follows (in millions).
2012 2011
Projected benefit obligation, beginning of year ................................................ $12,992 $10,598
Service cost ............................................................................ 247 191
Interest cost ............................................................................ 583 568
Benefits paid ........................................................................... (879) (579)
Business acquisitions ..................................................................... 8 1,017
Actuarial (gains) or losses and other ......................................................... 1,122 1,197
Projected benefit obligation, end of year ..................................................... $14,073 $12,992
57