Berkshire Hathaway 2012 Annual Report Download - page 60
Download and view the complete annual report
Please find page 60 of the 2012 Berkshire Hathaway annual report below. You can navigate through the pages in the report by either clicking on the pages listed below, or by using the keyword search tool below to find specific information within the annual report.-
 1
1 -
2
-
3
-
4
-
5
-
6
-
7
-
8
-
9
-
10
-
11
-
12
-
13
-
14
-
15
-
16
-
17
-
18
-
19
-
20
-
21
-
22
-
23
-
24
-
25
-
26
-
27
-
28
-
29
-
30
-
31
-
32
-
33
-
34
-
35
-
36
-
37
-
38
-
39
-
40
-
41
-
42
-
43
-
44
-
45
-
46
-
47
-
48
-
49
-
 50
50 -
 51
51 -
 52
52 -
 53
53 -
 54
54 -
 55
55 -
 56
56 -
 57
57 -
 58
58 -
 59
59 -
 60
60 -
 61
61 -
 62
62 -
 63
63 -
 64
64 -
 65
65 -
 66
66 -
 67
67 -
 68
68 -
 69
69 -
 70
70 -
71
-
72
-
73
-
74
-
75
-
76
-
77
-
78
-
79
-
80
-
81
-
82
-
83
-
84
-
85
-
86
-
87
-
88
-
89
-
90
-
91
-
92
-
93
-
94
-
95
-
96
-
97
-
98
-
99
-
100
-
101
-
102
-
103
-
104
-
105
-
106
-
107
-
108
-
109
-
110
-
111
-
112
 |
 |

Notes to Consolidated Financial Statements (Continued)
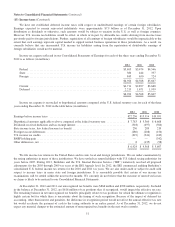
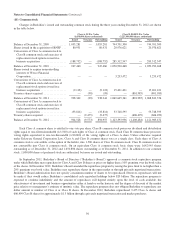
(20) Pension plans (Continued)
Benefit obligations under qualified U.S. defined benefit pension plans are funded through assets held in trusts. Pension
obligations under certain non-U.S. plans and non-qualified U.S. plans are unfunded. As of December 31, 2012, PBOs of non-
qualified U.S. plans and non-U.S. plans which are not funded through assets held in trusts were $1,048 million. A reconciliation
of the changes in assets of all plans for each of the years ending December 31, 2012 and 2011 is presented in the table that
follows (in millions).
2012 2011
Plan assets at beginning of year ............................................................. $ 9,150 $8,246
Employer contributions .................................................................... 649 523
Benefits paid ............................................................................ (879) (579)
Actual return on plan assets ................................................................ 1,429 361
Business acquisitions ...................................................................... 6 632
Other .................................................................................. 81 (33)
Plan assets at end of year ................................................................... $10,436 $9,150
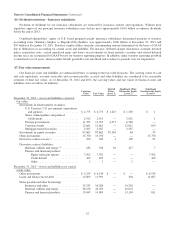
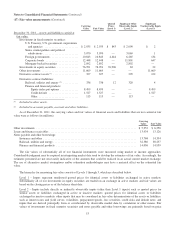
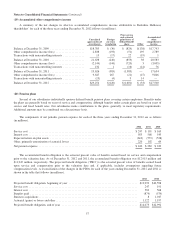
Fair value measurements for pension assets as of December 31, 2012 and 2011 follow (in millions).
Total
Fair Value
Quoted Prices
(Level 1)
Significant
Other
Observable
Inputs
(Level 2)
Significant
Unobservable
Inputs
(Level 3)
December 31, 2012
Cash and equivalents .......................................... $ 900 $ 345 $ 555 $ —
Government obligations ........................................ 899 529 370 —
Investment funds ............................................. 2,069 413 1,650 6
Corporate debt obligations ...................................... 689 86 603 —
Equity securities .............................................. 5,444 5,211 233 —
Other ....................................................... 435 12 97 326
$10,436 $6,596 $3,508 $332
December 31, 2011
Cash and equivalents .......................................... $ 830 $ 797 $ 33 $ —
Government obligations ........................................ 915 534 380 1
Investment funds ............................................. 1,872 402 1,465 5
Corporate debt obligations ...................................... 1,180 95 1,085 —
Equity securities .............................................. 3,618 3,432 186 —
Other ....................................................... 735 37 314 384
$ 9,150 $5,297 $3,463 $390
Refer to Note 17 for a discussion of the three levels in the hierarchy of fair values. Pension assets measured at fair value
with significant unobservable inputs (Level 3) for the years ending December 31, 2012 and 2011 consisted primarily of real
estate and limited partnership interests. Pension plan assets are generally invested with the long-term objective of earning
amounts sufficient to cover expected benefit obligations, while assuming a prudent level of risk. Allocations may change as a
result of changing market conditions and investment opportunities. The expected rates of return on plan assets reflect subjective
assessments of expected invested asset returns over a period of several years. Generally, past investment returns are not given
significant consideration when establishing assumptions for expected long-term rates of returns on plan assets. Actual
experience will differ from the assumed rates.
Benefits payments expected over the next ten years are as follows (in millions): 2013 – $704; 2014 – $708; 2015 – $719;
2016 – $701; 2017 – $750; and 2018 to 2022 – $3,877. Sponsoring subsidiaries expect to contribute $377 million to defined
benefit pension plans in 2013.
58