Berkshire Hathaway 2012 Annual Report Download - page 28
Download and view the complete annual report
Please find page 28 of the 2012 Berkshire Hathaway annual report below. You can navigate through the pages in the report by either clicking on the pages listed below, or by using the keyword search tool below to find specific information within the annual report.-
 1
1 -
2
-
3
-
4
-
5
-
6
-
7
-
8
-
9
-
10
-
11
-
12
-
13
-
14
-
15
-
16
-
17
-
 18
18 -
 19
19 -
 20
20 -
 21
21 -
 22
22 -
 23
23 -
 24
24 -
 25
25 -
 26
26 -
 27
27 -
 28
28 -
 29
29 -
 30
30 -
 31
31 -
 32
32 -
 33
33 -
 34
34 -
 35
35 -
 36
36 -
 37
37 -
 38
38 -
39
-
40
-
41
-
42
-
43
-
44
-
45
-
46
-
47
-
48
-
49
-
50
-
51
-
52
-
53
-
54
-
55
-
56
-
57
-
58
-
59
-
60
-
61
-
62
-
63
-
64
-
65
-
66
-
67
-
68
-
69
-
70
-
71
-
72
-
73
-
74
-
75
-
76
-
77
-
78
-
79
-
80
-
81
-
82
-
83
-
84
-
85
-
86
-
87
-
88
-
89
-
90
-
91
-
92
-
93
-
94
-
95
-
96
-
97
-
98
-
99
-
100
-
101
-
102
-
103
-
104
-
105
-
106
-
107
-
108
-
109
-
110
-
111
-
112
 |
 |

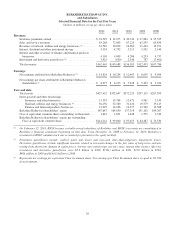
BERKSHIRE HATHAWAY INC.
and Subsidiaries
Selected Financial Data for the Past Five Years
(dollars in millions except per-share data)
2012 2011 2010 2009 2008
Revenues:
Insurance premiums earned ............................. $ 34,545 $ 32,075 $ 30,749 $ 27,884 $ 25,525
Sales and service revenues .............................. 83,268 72,803 67,225 62,555 65,854
Revenues of railroad, utilities and energy businesses (1) ....... 32,582 30,839 26,364 11,443 13,971
Interest, dividend and other investment income ............. 4,534 4,792 5,215 5,531 5,140
Interest and other revenues of finance and financial products
businesses ......................................... 4,109 4,009 4,286 4,293 4,757
Investment and derivative gains/losses (2) .................. 3,425 (830) 2,346 787 (7,461)
Total revenues ....................................... $162,463 $143,688 $136,185 $112,493 $107,786
Earnings:
Net earnings attributable to Berkshire Hathaway (2) .......... $ 14,824 $ 10,254 $ 12,967 $ 8,055 $ 4,994
Net earnings per share attributable to Berkshire Hathaway
shareholders (3) ..................................... $ 8,977 $ 6,215 $ 7,928 $ 5,193 $ 3,224
Year-end data:
Total assets .......................................... $427,452 $392,647 $372,229 $297,119 $267,399
Notes payable and other borrowings:
Insurance and other businesses ...................... 13,535 13,768 12,471 4,561 5,149
Railroad, utilities and energy businesses (1) ............. 36,156 32,580 31,626 19,579 19,145
Finance and financial products businesses .............. 13,045 14,036 14,477 13,769 12,588
Berkshire Hathaway shareholders’ equity .................. 187,647 164,850 157,318 131,102 109,267
Class A equivalent common shares outstanding, in thousands . . 1,643 1,651 1,648 1,552 1,549
Berkshire Hathaway shareholders’ equity per outstanding
Class A equivalent common share ...................... $114,214 $ 99,860 $ 95,453 $ 84,487 $ 70,530
(1) On February 12, 2010, BNSF became a wholly-owned subsidiary of Berkshire and BNSF’s accounts are consolidated in
Berkshire’s financial statements beginning on that date. From December 31, 2008 to February 12, 2010, Berkshire’s
investment in BNSF common stock was accounted for pursuant to the equity method.
(2) Investment gains/losses include realized gains and losses and non-cash other-than-temporary impairment losses.
Derivative gains/losses include significant amounts related to non-cash changes in the fair value of long-term contracts
arising from short-term changes in equity prices, interest rates and foreign currency rates, among other factors. After-tax
investment and derivative gains/losses were $2.2 billion in 2012, $(521) million in 2011, $1.87 billion in 2010,
$486 million in 2009 and $(4.65) billion in 2008.
(3) Represents net earnings per equivalent Class A common share. Net earnings per Class B common share is equal to 1/1,500
of such amount.
26